Figure 4.
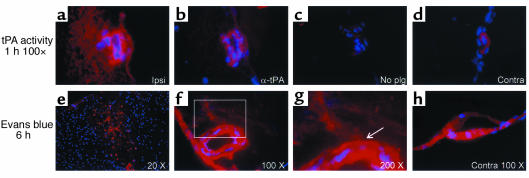
Temporal and spatial relationship between tPA activity and vascular permeability following MCAO in WT (C57BL/6J) mice. In a–d, tPA activity 1 hour after MCAO is shown in red by in situ zymography, and cell nuclei are in blue (DAPI). (a) By 1 hour after MCAO there is significant tPA activity in the vessel wall and in the perivascular tissue surrounding a vessel bordering the necrotic area. (b and c) The same vessel in adjacent sections (5 μm), but with anti-tPA antibodies included (b), or without the addition of Plg (c) in the overlay. (d) The background tPA activity associated with a vessel in a corresponding area in the contralateral hemisphere from the same section shown in a. In a–d the original magnification was ×100. (e–h) Evans blue extravasation is shown in red and cell nuclei in blue (DAPI) 6 hours after MCAO. (e) A low-magnification view of the entire ischemic area. (f) Evans blue extravasation from a vessel located in the area adjacent to the ischemic area, similar to the one seen in a. (g) Electronic magnification of the box in f. The arrow indicates an area of Evans blue leakage outside the internal elastic lamina of the vessel. (h) Evans blue is shown adhering to the vessel wall, but no extravasation is seen in a vessel from the same section seen in f and g but located in the corresponding region of the contralateral hemisphere. Ipsi, ipsilateral; Contra, contralateral.

