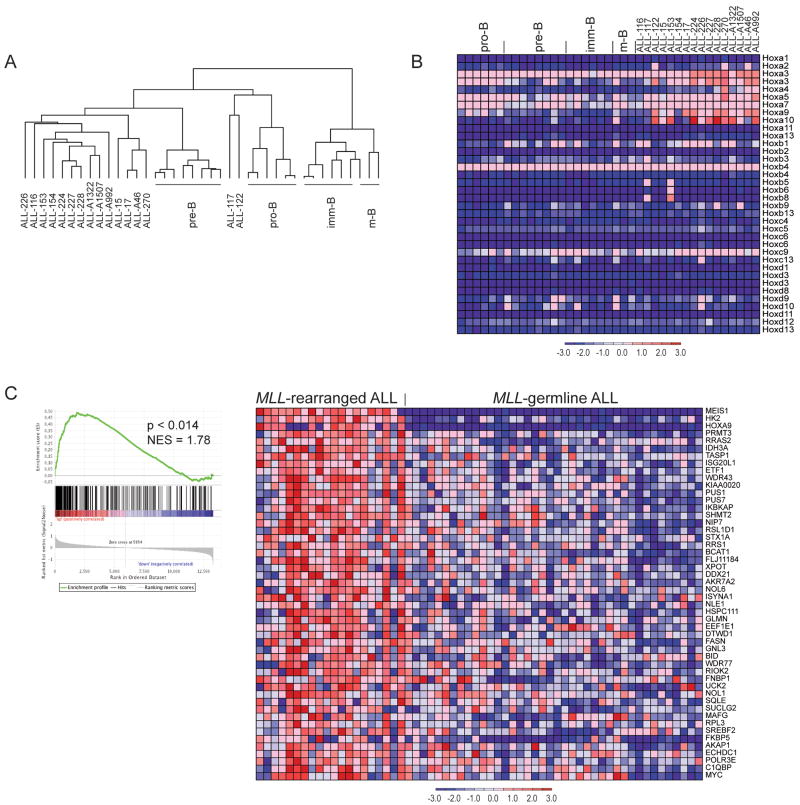
Figure 3. Gene expression in normal and malignant mouse B-cells and comparison to human leukemias.
A Hierarchical clustering using 10218 filtered (min fold 3; min delta 100, background 20; ceiling 20000) probe sets. B. Expression of homeobox A, B, C, and D cluster genes in normal developing B-lymphocytes and B-pr ALL cells. C. GSEA analysis of gene expression in human MLL-rearranged ALL (n=20) as compared to MLL-germline ALL (n=40) (Ross et al., 2003) using the top 386 genes identified as highly expressed in murine Mll-AF4 ALL as a gene set. GSEA enrichment plot (left) and the top 50 genes that show increased expression in human MLL-rearranged leukemias are shown (right).

