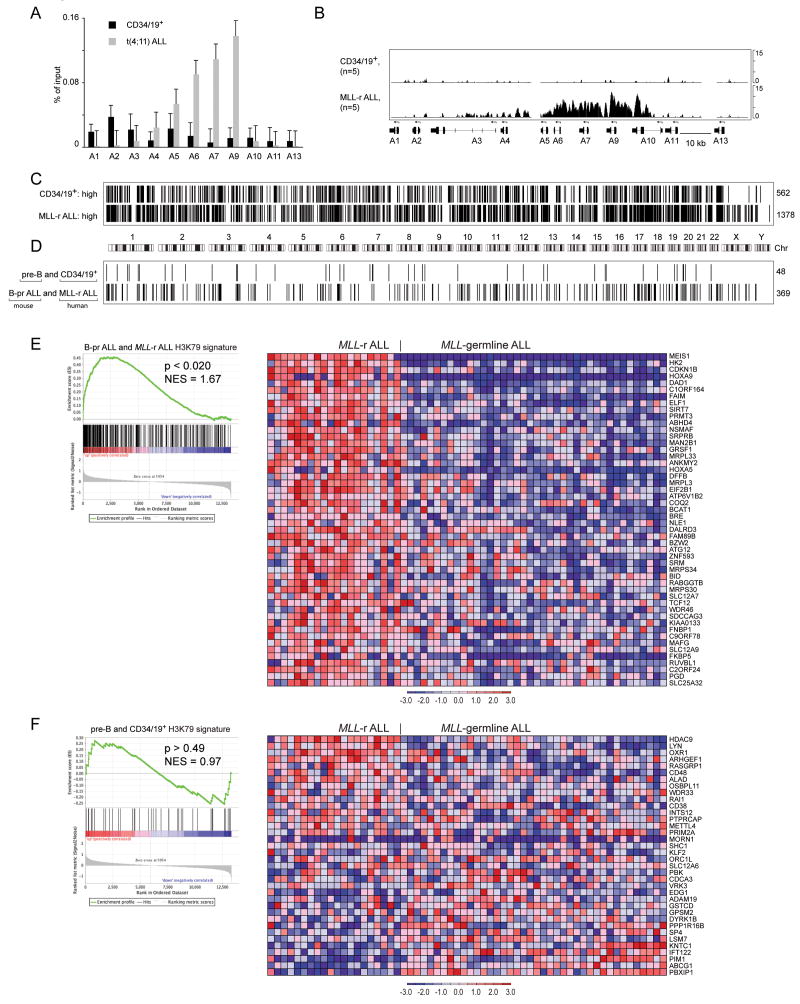
Figure 5. ChIP-chip analysis of histone methylation in human MLL-rearranged ALL and normal pre-B cells.
A Enrichment of H3K79-dimethyl marks associated with HOXA cluster promoters in t(4;11) ALL and human bone marrow Lin− CD34+ CD19+ (CD34/19+) cells expressed as percentage of input as assessed by ChIP-qPCR. Error bars represent +/− SD of triplicates in one of 3 independent experiments. B. Identically scaled average tracks from ChIP-chip analysis of H3K79me2 modifications associated with HOXA cluster loci in human CD34/19+ cells (n=5) or MLL-rearranged ALL (MLL-r ALL) (n=5). C. Graphical (bar) representation of regions associated with H3K79me2 in normal CD34/CD19+ and MLL-rearranged ALL cells. 562 genes were identified in CD34/19+ cells but not in MLL-rearranged ALL (CD34/19+: high) whereas 1378 genes with significant H3K79 signal were present in MLL-rearranged ALL but not CD34/19+ cells (MLL-r ALL: high). D. 48 genes had higher H3K79 ChIP-chip signals in both mouse pre-B and human CD34/19+ cells as compared to mouse and human leukemias. 369 genes had higher H3K79 ChIP-chip signal in both mouse Mll-AF4 and human MLL-rearranged ALL as compared to normal B-cells. Fisher test p<0.0001. E. GSEA analysis of the 369-gene signature with elevated H3K79me2 found in both human MLL-rearranged ALL and mouse B-pr ALL found enrichment of the gene expression signature in MLL-rearranged ALL as compared to MLL-germline ALL (NES=1.63, p<0.019). GSEA enrichment plot (left) and heatmap (right) of expressio n for the top 50 probe sets in MLL-rearranged ALL as compared to MLL-germline ALL (Ross et al., 2003). F. GSEA analysis of the 48 genes with elevated H3K79me2 found in both human bone marrow CD34/CD19+ and mouse pre-B cells found no enrichment of the signature in MLL-rearranged ALL as compared to MLL-germline ALL (NES=0.97, p>0.49). GSEA enrichment plot (left) and heatmap (right) of expression for 36 probe sets in MLL-rearranged ALL as compared to MLL-germline ALL (Ross et al., 2003).

