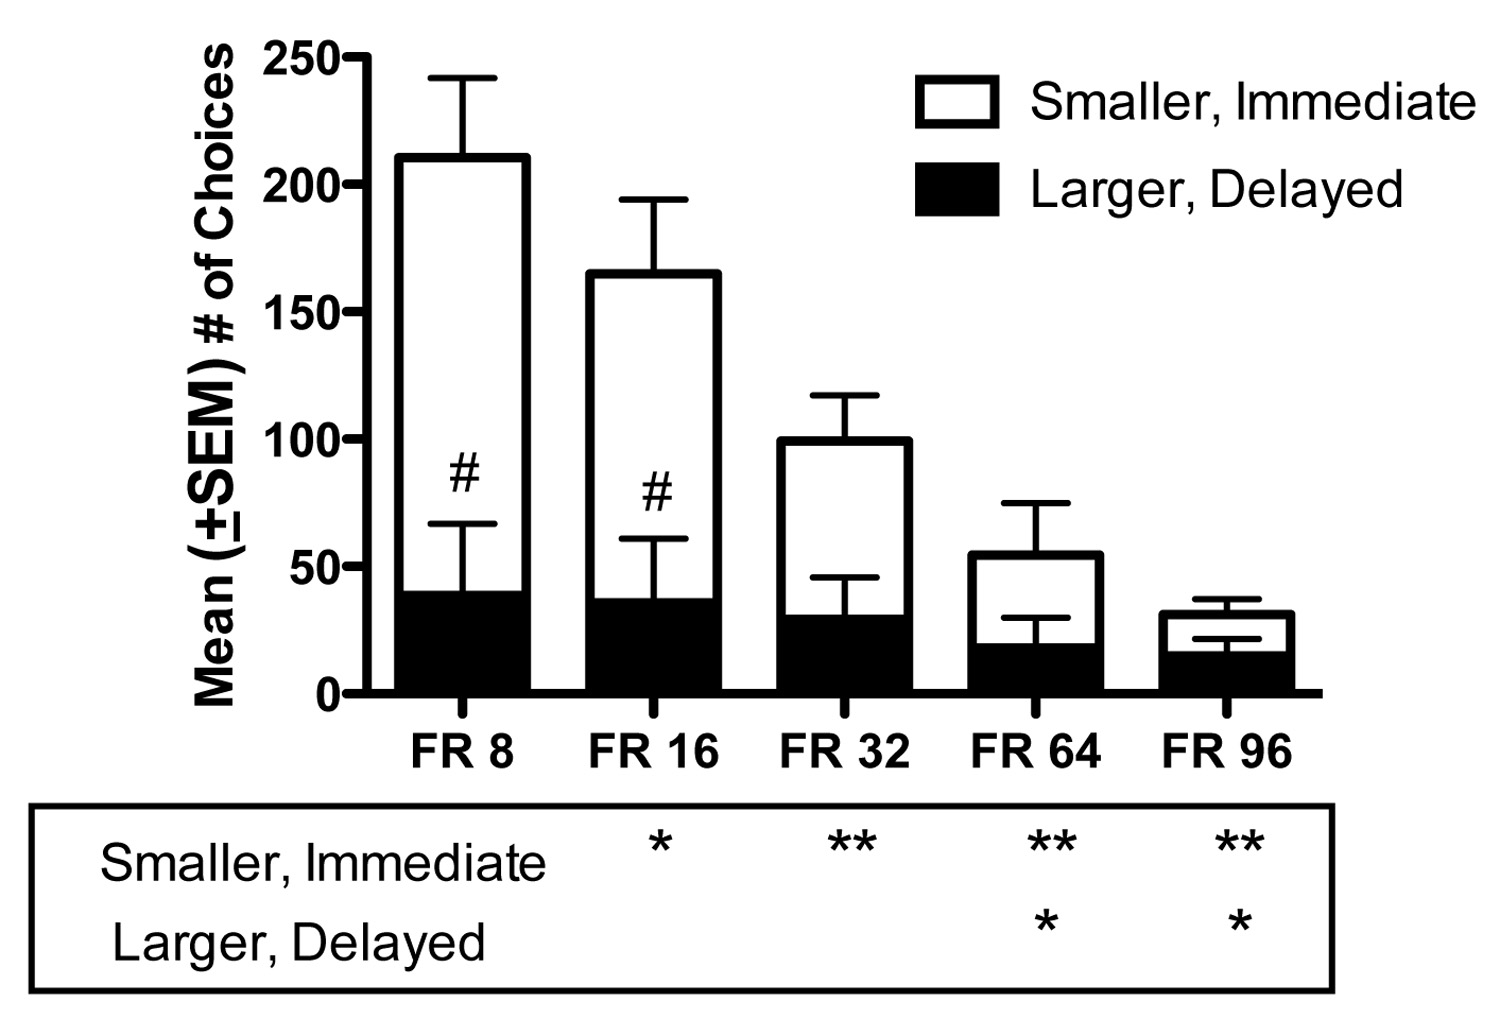
Figure 2.

(a) Mean (±SEM) numbers of PCP deliveries, (b) mean (±SEM) adjusted delay (seconds), and (c) mean (±SEM) number of total choices as a function of FR requirement. Divided bars show numbers of smaller, immediate reinforcer choices (white section) and larger, delayed reinforcer choices (black section). Data represent the means of 6 sessions obtained in the group of 8 monkeys, except at FR 96, for which only 6 of 8 monkeys were tested. Solid horizontal lines between bars indicate P < 0.05 and dashed lines indicate P < 0.01. *P < 0.05 and **P < 0.01 compared to FR 8. #P < 0.01 compared to smaller, immediate reinforcer choices.
