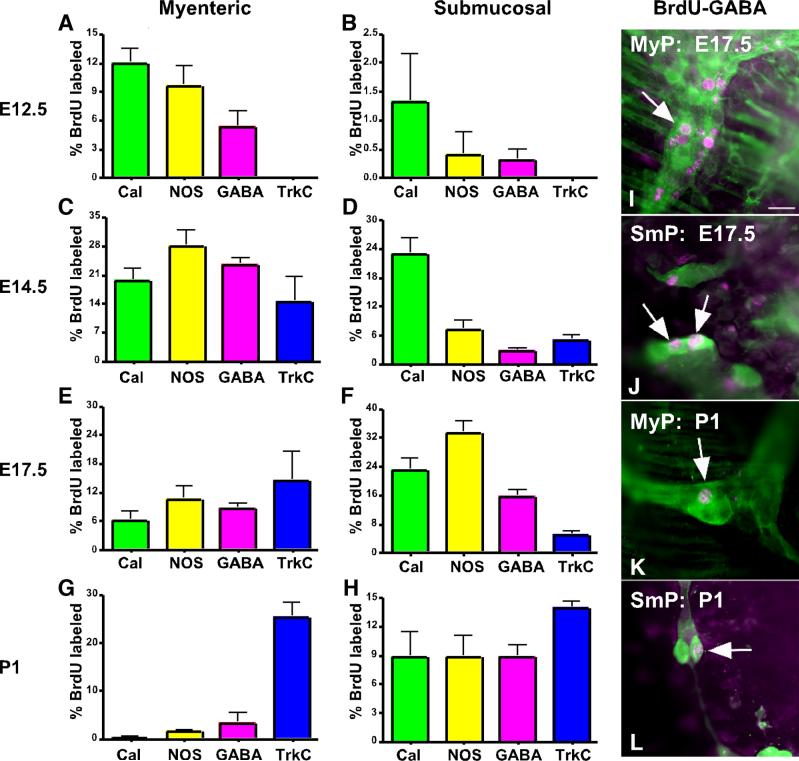
Figure 6.
Timing of the exit from the cell cycle of precursors that give rise to neurons identified by the immunoreactivities of calbindin, NOS, GABA, and TrkC as determined by injecting BrdU into dated-pregnant mice. Neurons labeled by BrdU during the final mitosis of their precursors were identified by simultaneously demonstrating BrdU immunoreactivity with that of the neuronal markers. One measurement of the proportion of BrdU-labeled neurons was determined as the sum of BrdU-labeled neurons divided by the total number of neurons of a specific phenotype found in 10 scanned fields. Each measurement was then repeated 5−24 times. The numbers found in each measurement were then totaled and divided by the number of measurements to calculate the mean. Cell cycle exit dates are shown at the left and for each age a histogram is plotted showing the % of each type of neuron labeled with BrdU. A. E12.5 Myenteric plexus. B. E12.5 Submucosal plexus. C. E14.5 Myenteric plexus. D. E14.5 Submucosal plexus. E. E17.5 Myenteric plexus. F. E17.5 Submucosal plexus. G. P1 Myenteric plexus. H. P1 Submucosal plexus. I-L. BrdU labeling (magenta) of GABA-immunoreactive neurons (green) in the myenteric (MyP) and submucosal (SmP) plexuses: I. E17.5, myenteric plexus; J. E17.5, submucosal plexus; K. P1, myenteric plexus; L. P1, submucosal plexus . Arrows indicate doubly labeled cells. The bar = 50 μm.

