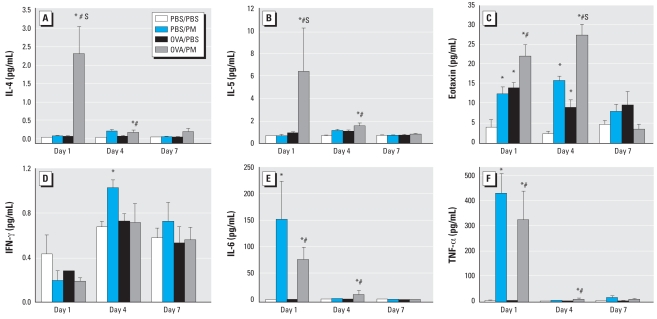
Figure 3.
Effect of Baltimore PM on TH2 (A–C) and TH1 (D–F) cytokine levels in BAL fluid. (A–C) Levels of BAL TH2 cytokines IL-4 (A), IL-5 (B), and eotaxin (C) and (D–F) levels of BAL TH1 cytokines IFN-γ (D), IL-6 (E), and TNF-α (F). Values are mean ± SE; n = 4–5.
*Significant increase over PBS/PBS control for each time point (p < 0.05). #Significant increase over PBS/OVA group for each time point (p < 0.05). S, synergistic effect between PM and OVA treatment (SI > 1).

