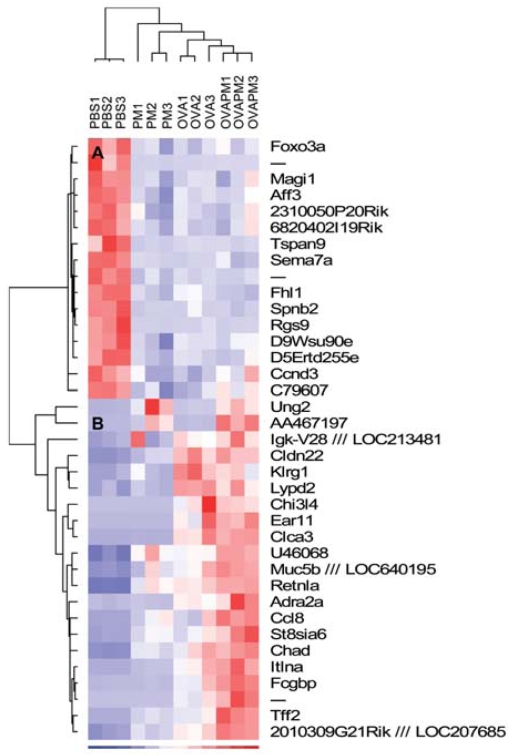
Figure 7.
Hierarchical clustering of OVA-induced dysregulated genes by dChip. The 37 dysregulated genes induced by OVA treatment were selected by SAM software (see Supplemental Material, Table 1, online at http://www.ehponline.org/members/2008/11229/suppl.pdf). Sample clustering is displayed at the top; the two gene clusters A and B are displayed on the left. Blue, white, and red represent the expression level below, at, and above mean level, respectively. PBS1, PBS control sample 1; PM1, PM-treated sample 1; OVA1, OVA-treated sample 1; OVAPM1, OVA- and PM-treated sample 1.

