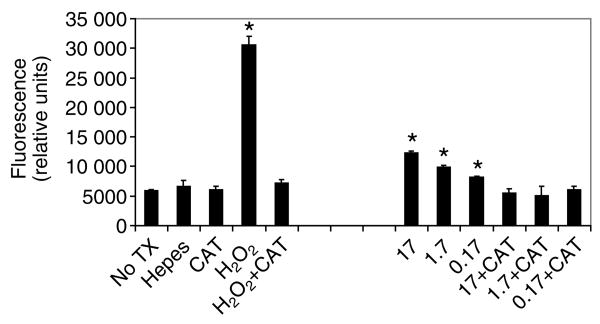
Fig. 4.
Human insulin dose-dependently induced hydrogen peroxide synthesis in A. stephensi MSQ43 cells. MSQ43 cells were stimulated with human insulin (Ins, 0.17–17 μmol l−1) and assayed for H2O2 using DCF-DA. Controls included no treatment (No TX), treatment with an equivalent volume of insulin buffer (Hepes), treatment with 100 units ml−1 catalase (CAT), treatment with 500 μmol l−1 H2O2, and pre-treatment with catalase (+CAT) followed by treatment with H2O2 or insulin. Data are represented as mean relative fluorescence units ± s.e.m. (N=3). An asterisk denotes a significant difference (α=0.05) between treatment and no treatment (No TX).

