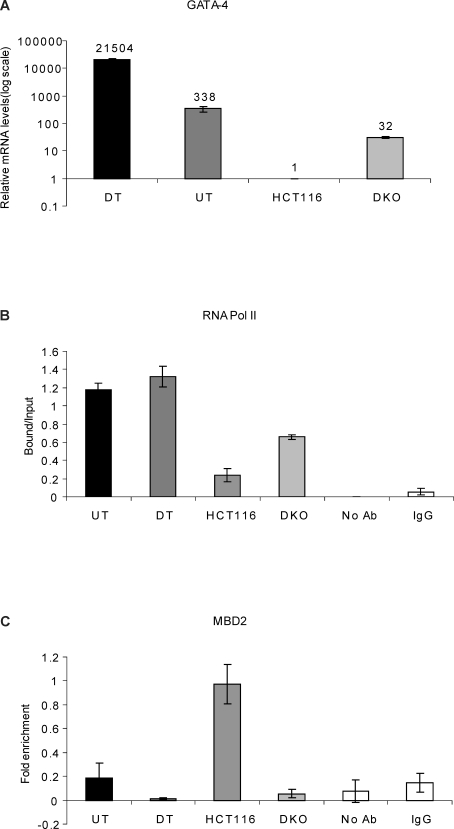
Figure 2. The Frequency of Long-Range Chromatin Interactions at the GATA-4 Locus Correlates with the Transcriptional Status of the Gene and Is Associated with the Differential Occupancy of RNA Pol II and MBD2 at the GATA-4 Promoter in the Four Cell Types.
(A) Realtime RT-PCR analysis for relative comparison of GATA-4 transcript levels reveals differences among the four cell types- HCT116, DKO, undifferentiated Tera-2 and differentiated Tera-2 cells, which correspond well with the spatial organization of the GATA-4 locus. The numbers on top of the bars indicate fold up-regulation in GATA-4 mRNA levels in the three cell-types as compared to the HCT116 cells, which was just above a baseline value and is set to 1. Note that the relative mRNA levels on the y-axis are plotted logarithmically.
(B) ChIP analysis for RNA Polymerase II occupancy at the GATA-4 promoter in undifferentiated Tera-2, differentiated Tera-2, HCT116, and DKO cells. ChIP was performed using antibodies against the initiating form of RNA Polymerase II followed by PCR using primers spanning the promoter region and the products were resolved on a 2% agarose gel and quantitated using KODAK Gel Logic 2000 imaging system. Average enrichments, from separate assays, are plotted on the y-axis as the ratio of precipitated DNA (bound) to the total input DNA (1:100 dilution) and are compared with the control samples (no antibody and IgG). Standard errors of the mean are indicated by the brackets. UT = undifferentiated Tera-2 cells, DT = differentiated Tera-2 cells.
(C) MBD2 is enriched at the GATA-4 promoter region only in HCT116 cells and not in the other three cell types. ChIP was performed using antibody against MBD2, and the precipitated DNA was amplified by real-time qPCR using primers specific for the promoter CpG island in UT, DT, HCT116, and DKO cells. Enrichments are presented as folds of total input and are compared with the control samples (no antibody and IgG). Standard errors of the mean are indicated by the brackets. UT= undifferentiated Tera-2 cells, DT= differentiated Tera-2 cells.

