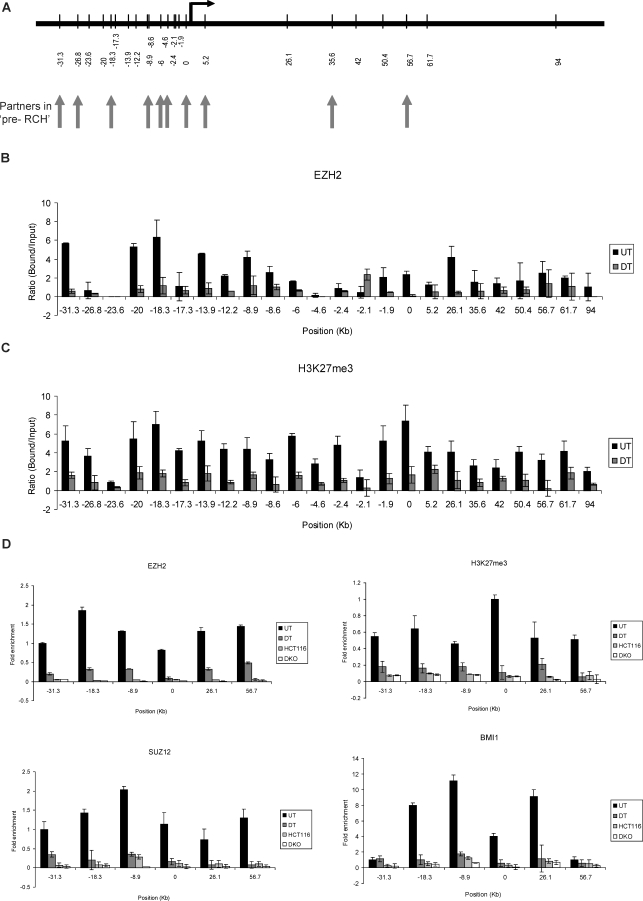
Figure 3. PcG Proteins and Associated H3K27 Marks Occupy Broad Chromatin Domains throughout the GATA-4 Locus.
(A) Schematic representation of location of various chromatin regions (in kb) at the human GATA-4 locus, queried by semiquantitative ChIP analysis for various components of the PcG repression system, including all the EcoRI enzyme sites used for the 3C analysis. The vertical arrows point towards the EcoRI sites that were discovered to be involved in long-range chromatin interactions in undifferentiated Tera-2 cells.
(B and C) Quantitation of the gel-based PCR analysis of various fragments at the GATA-4 locus for EZH2 (B) and H3K27me3 (C) occupancy for undifferentiated and differentiated Tera-2 cells. Following the PCRs using primers spanning the EcoRI sites shown in (A), the products were resolved on a 2% agarose gel and quantitated using the KODAK Gel Logic 2000 imaging system. Average enrichments, from separate assays, are presented as the ratio of precipitated DNA (bound) to the total input DNA (1:100 dilution) and are plotted on the y-axis. Standard errors of the mean are indicated by the brackets. Black bars represent undifferentiated Tera-2 cells (UT), and grey bars represent differentiated Tera-2 cells (DT).
(D) ChIP was performed using antibodies against EZH2, H3K27me3, SUZ12, and BMI1. The precipitated DNA was amplified by real-time qPCR using primers specific for some selected fragments (−31.3, −18.3, −8.9, 0, +26.1, and +56.7) in undifferentiated Tera-2 cells, differentiated Tera-2 cells, HCT116, and DKO cells. Enrichments are presented as folds of total input.

