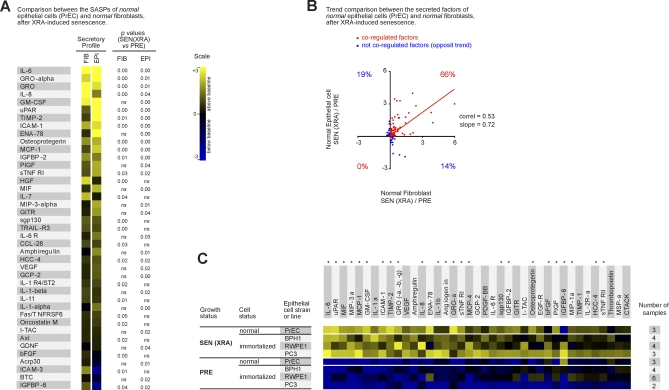
Figure 2. SASP of Human Epithelial Cells.
(A) Soluble factors secreted by the indicated normal cell type (epithelial vs. stromal) were detected by antibody arrays and analyzed as described in the text, Materials and Methods, and Datasets S5–S8. Normal prostate epithelial cells (PrECs) were induced to senesce by 10 Gy irradiation, and CM from the PRE and SEN cells were analyzed. The SASP of PrECs was compared side by side to the SASP of SEN(XRA) fibroblasts (WI-38, IMR-90, HCA-2, and BJ). The PRE values for each cell type served as the baseline. Signals higher than baseline are displayed in yellow; signals below baseline are displayed in blue. The heat map key (right) indicates log2-fold changes from the baseline. p-Values were calculated by the Student t-test, and are given to the right of the heat map. ns = not significant (p > 0.05) and defines non-SASP factors.
(B) The log2-fold changes for all 120 proteins detected by the antibody arrays were plotted for SEN(XRA) PrECs and SEN(XRA) fibroblasts, relative to their PRE baseline. Seventy-nine secreted factors (66%) followed the same regulatory trend (in red). The remaining factors were not coregulated (depicted in blue).
(C) Soluble factors produced by the indicated normal or transformed prostate epithelial cells were analyzed by antibody arrays and the results displayed as described for Figure 1A. For each cell strain or cell line, PRE and SEN signals were averaged and used as the baseline. Signals higher than the baseline are shown in yellow; signals below baseline are displayed in blue. An asterisk (*) indicates SASP factors that are conserved between all fibroblasts (Figure 1A) and all epithelial cells.

