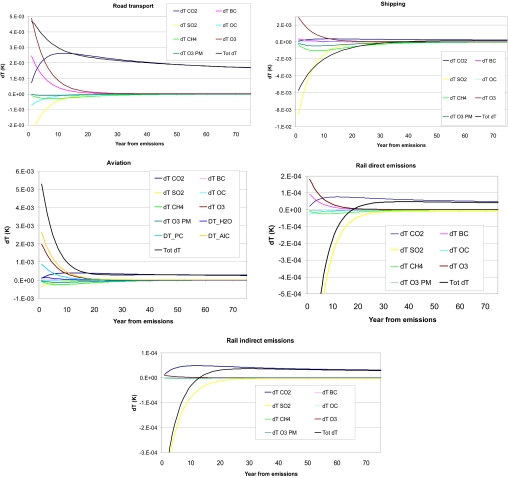
Fig. 1.
Global mean temperature (Kelvin) change after 1 year of emissions from the major transportation modes given per component and for the total net effect. AIC, aviation-induced cirrus; PC, persistent contrails; O3 PM, primary mode ozone. Note that the first data points represent the responses 12 months after the emissions perturbations.

