
Figure 4. The roles of the cytoskeleton and RhoA signaling pathway on the spontaneous cytoplasmic Ca2+ oscillation.
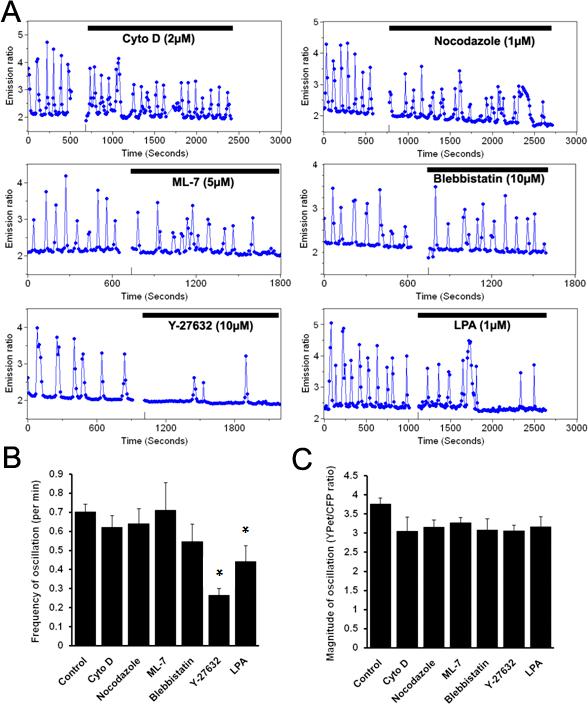
(A): Representative time courses of the cytoplasmic Ca2+ concentration in cells pre-treated with Cyto D (2 μM, n=3), Noc (1 μM, n=3), ML-7 (5 μM, n=5), blebbistatin (10 μM, n=5), Y-27632 (10 μM, n=5), and LPA (1 μM, n=10). (B) and (C): Bar graphs (mean ± S.E.M.) represent the (B) frequency and (C) magnitude of spontaneous Ca2+ oscillations in cells pretreated with different reagents, as indicated. Error bars indicate standard errors of mean; *p<0.05.