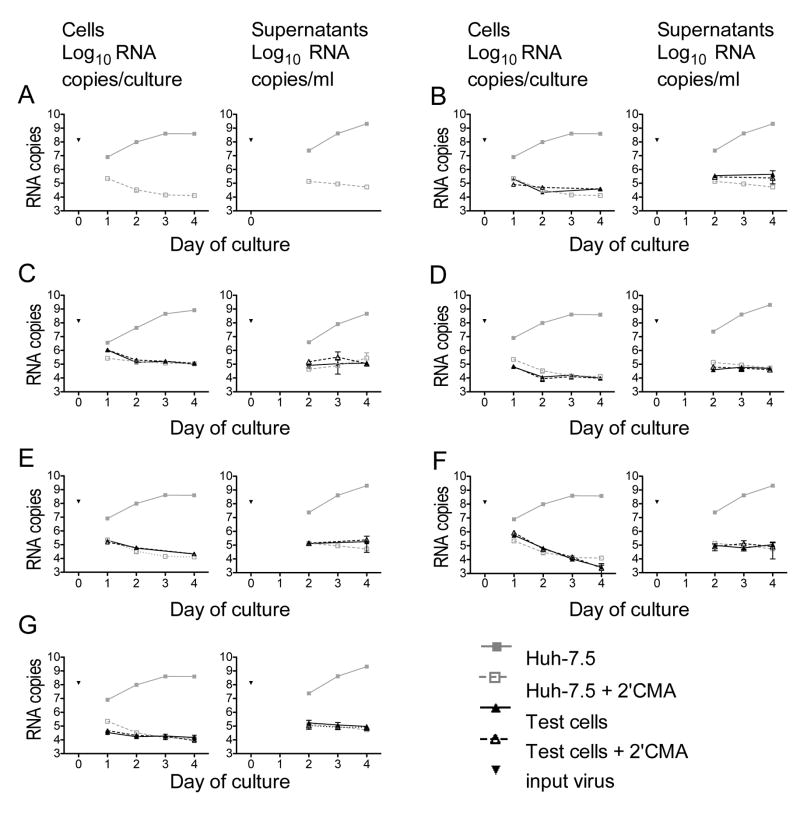
Figure 2. HCVcc infection of Huh-7.5 cells and PBMC subsets in the absence and presence of the NS5B inhibitor, 2’CMA.
HCVcc (5×10⁵ TCID50 units) was added to 106 cells; cultures were washed after 24 hr. RNA was prepared from cells and culture supernatants at the indicated times after infection. The amount of input HCV RNA is shown for each experiment. HCV RNA levels in parallel cultures of Huh-7.5 cells are shown in grey for each plot. Each point represents the mean ± SD of three replicates; experiment shown is representative of 10 similar experiments. (A) Huh-7.5 cells. (B) B cells. (C) Monocyte-derived DCs. (D) Mϕ. (E) pbDCs. (F) Monocytes. (G) T and NK cells.

