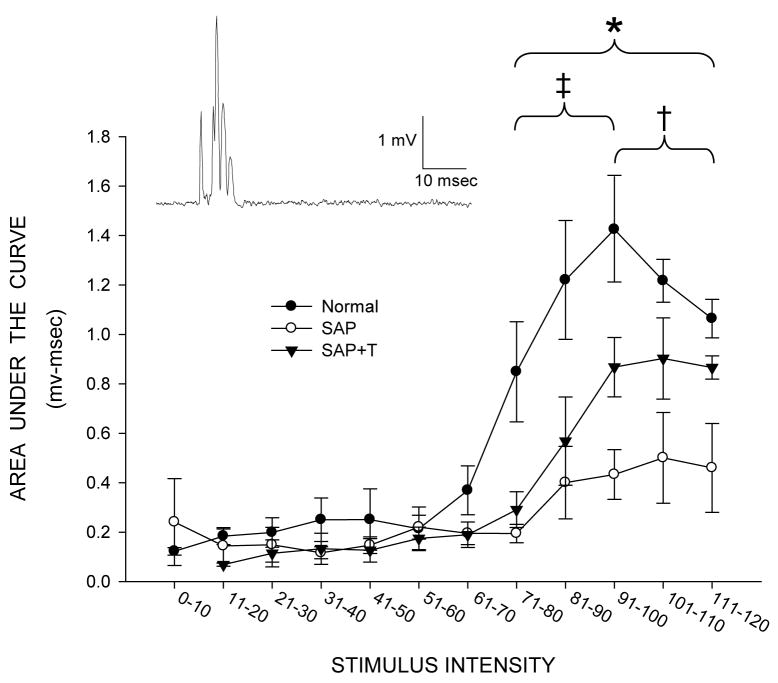
Figure 8.
Inset: Representative rectified trace from a normal male of quadriceps motor nerve activity following stimulation of the L2 dorsal root. Response amplitudes as a function of stimulus intensity for normal males (filled circles), and saporin-injected animals that were either untreated (SAP, open circles), or treated with testosterone (SAP+T, triangles), measured as area under the curve. Motor nerve activation was significantly reduced in saporin-injected animals, but deficits in response amplitude were attenuated with testosterone treatment. Points represent means ± SEM. * indicates significant differences between saporin-injected animals and normal males. ‡ indicates significant differences between saporin-injected animals that were treated with testosterone and normal males. † indicates significant differences between saporin-injected animals that were untreated and those treated with testosterone.

