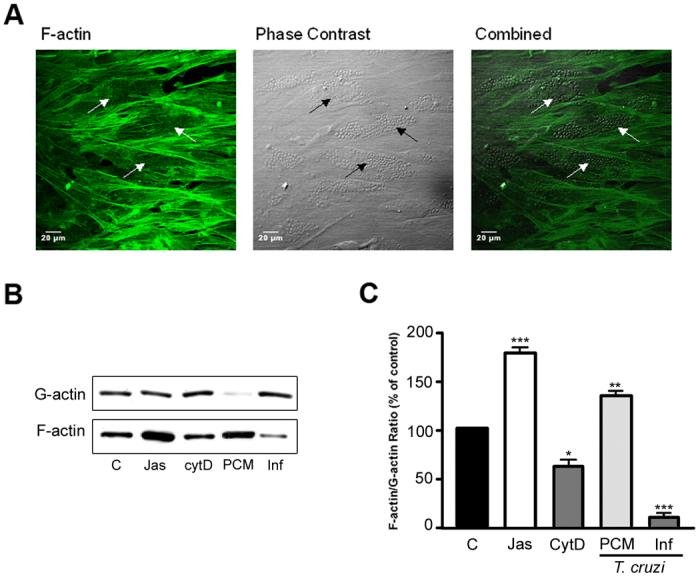
Figure 1. Reduction in the F-actin content in host fibroblasts.

A. Alexafluor 488-phalloidin staining of T. cruzi-infected HFF at 72 hours post-infection (left panel). Parasitized cells, as shown in the phase contrast image (center panel), lacked the actin filaments present in uninfected cells. The arrows highlight three infected cells. B. Biochemical quantification of F-actin to G-actin ratio in HFF treated with Jasplakinolide (Jas), cytochalasin D (CytD) or following T. cruzi infection for 72 hours. C. Quantification of relative F-actin content (% of total actin) following infection. Results from 4 independent experiments were quantified using densitometry of western blots revealing the reduction in F-actin in T. cruzi-infected cells (*p <0.05, **p<0.01, ***p<0.005 Student's t test).
