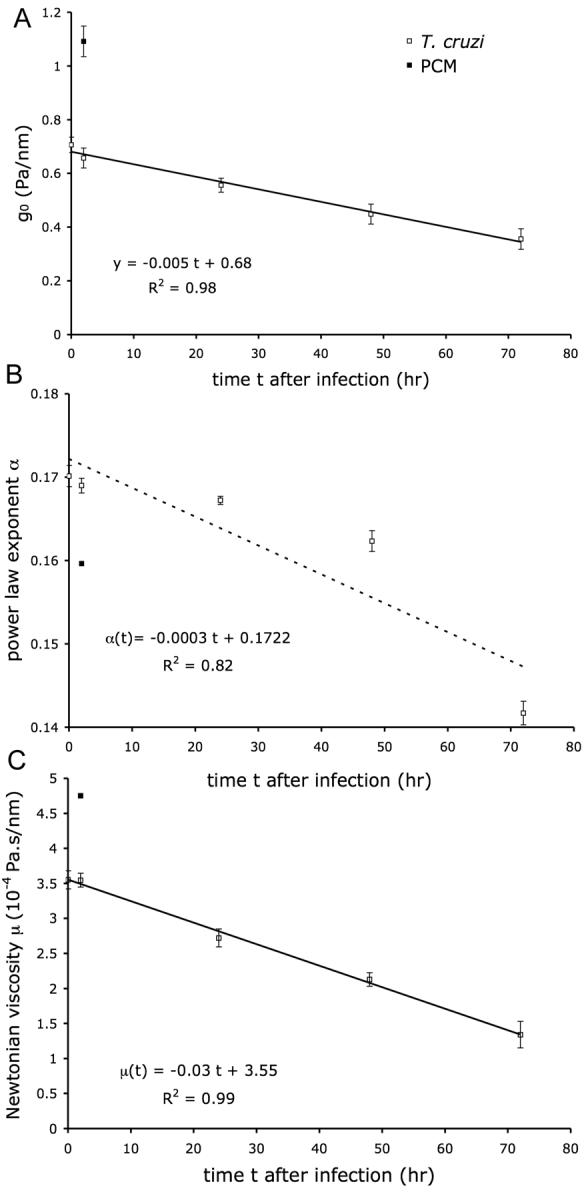
Figure 3. Changes in mechanical properties in fibroblasts infected with T. cruzi or treated with PCM.

T. cruzi-infected HFF at 2, 24, 48 and 72 hr post-infection (open symbols) or PCM-treated cells after 2 hr (closed symbols) were subjected to OMTC and analyzed as follows: A. g0 vs. time. Solid line: best fit by linear function of infection data. B. Power law exponent α vs. time. Dashed line: best fit by linear function of infection data. C. Newtonian viscosity μ vs. time. Solid line: best fit by linear function of infection data. All three parameters are obtained from fit of g′ and g″ with Eq. (1). Numbers of measurements are: for PCM data 582, and for infection data 1381, 681, 1126, 616, and 572 for 0, 2, 24, 48, and 72 hr respectively.
