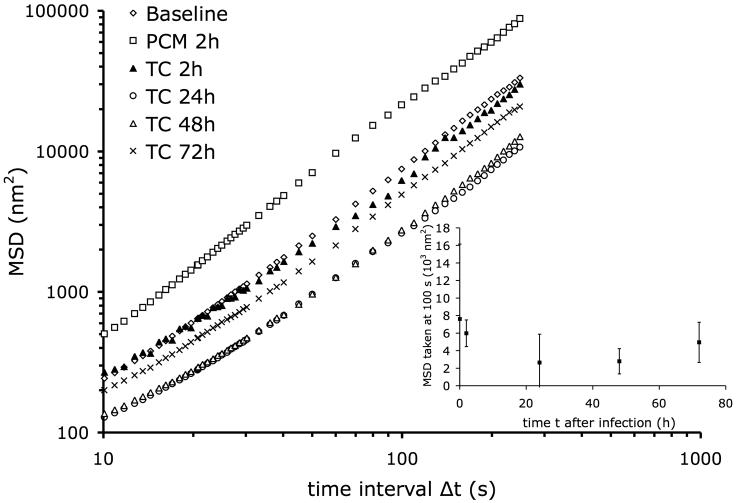
Figure 5. Changes in mean square displacements, MSD, vs. time lag, Δt, in T. cruzi infected cells.
HFF, at different time points after infection (0, 2, 24, 48, and 72 hr) and after 2 hr incubation with PCM were analyzed for changes in MSD. Inset: MSD taken at Δt = 100 s vs. time after infection; error bars are standard errors. Baseline, n = 1623; PCM 2h, n = 876; TC 2h, n = 727; TC 24h, n = 1131; TC 48h, n = 607; TC 72h, n = 622.

