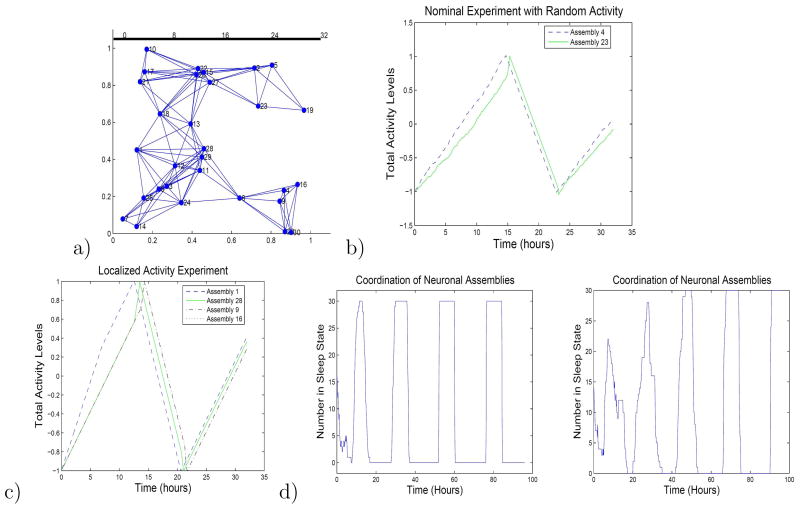
Figure 1.
a) The network topology for the 30-cortical-column example is illustrated. b) The baseline activity simulation is shown. c) The local overstimulation experiment is simulated; activity variables for five representative cortical columns (neuronal assemblies) are shown. d) The coordination experiment is simulated, for two different interaction strengths. Higher interaction strengths yield faster coordination.

