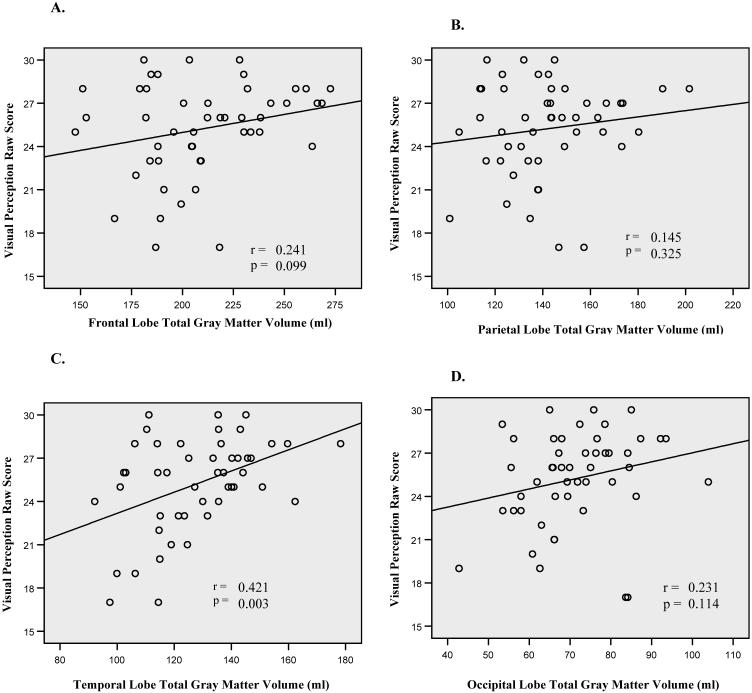
Figure 1. Relationship between VP Raw Scores and Lobar Gray Matter Volumes.
Scatterplots depicting the relationship between Visual Perception (VP) raw scores and (A.) frontal, (B) parietal, (C) temporal, and (D) occipital lobe gray matter volumes (ml). Temporal lobe volumes demonstrated the strongest correlation (r = 0.421), accounting for 18% of the variance.

