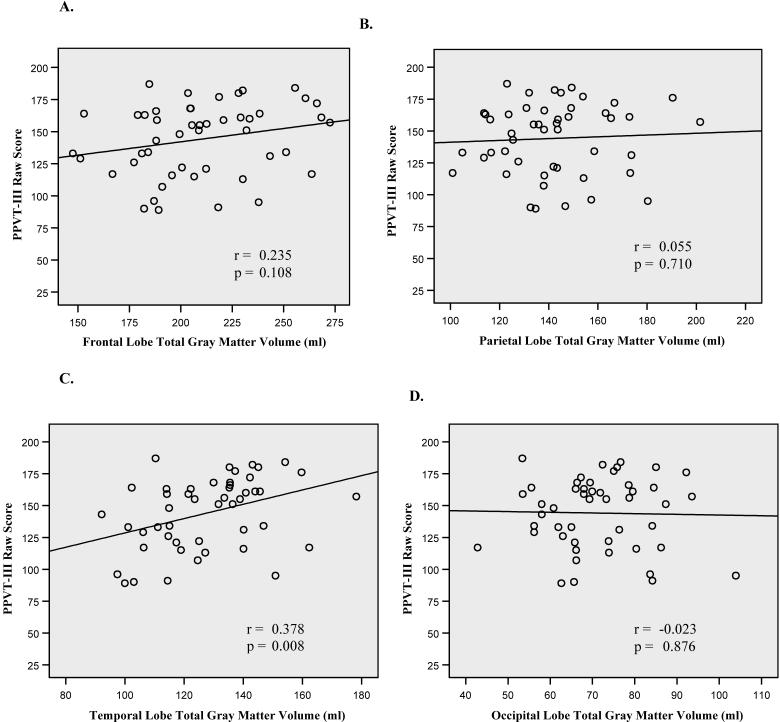
Figure 2. Relationship between PPVT-III Raw Scores and Lobar Gray Matter Volumes.
Scatterplots depicting the relationship between PPVT-III raw scores and (A.) frontal, (B) parietal, (C) temporal, and (D) occipital lobe gray matter volumes (ml). Temporal lobe volumes demonstrated the strongest correlation (r = 0.378), accounting for 14% of the variance.

