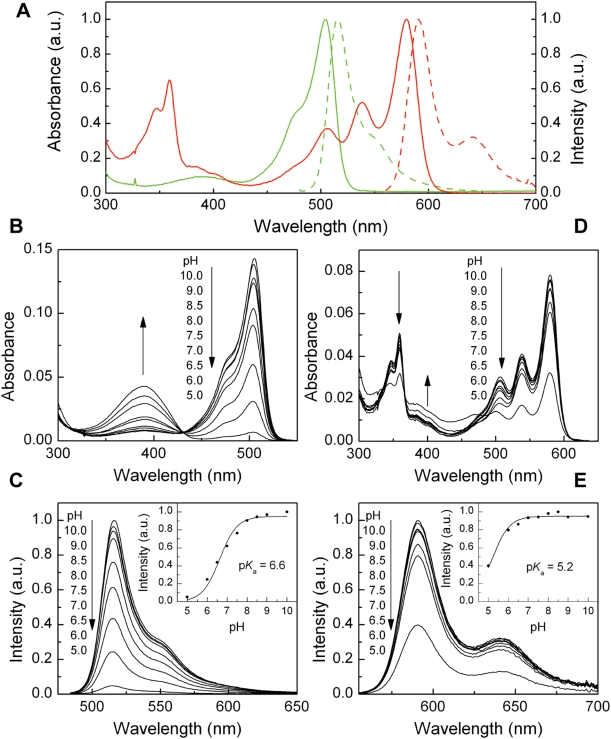
Figure 2. Spectroscopic properties of the green and red form of mKikGR.
(A) Normalized absorption (solid line) and fluorescence (dashed line) spectra of the green mKikGR (4.7 µM, green line) and red mKikGR (4.7 µM, red line). The red mKikGR was obtained by illuminating at 405 nm (12 mW cm−2) for 90 minutes. Fluorescence spectra of the green and red mKikGR were measured with 475 nm and 555 nm excitation, respectively. All measurements were performed at pH 8.0. (B, D) pH dependence of absorption spectra of the green (B) and red (D) mKikGR (4.7 µM). (C, E) pH dependence of fluorescence spectra of the green (C) and red (E) mKikGR (4.7 µM). Fluorescence spectra of the green and red mKikGR were measured with 475 nm and 555 nm excitation, respectively. (Inset) Peak fluorescence intensities at different pH. The solid lines show fitting with the Henderson-Hasselbalch equation.

