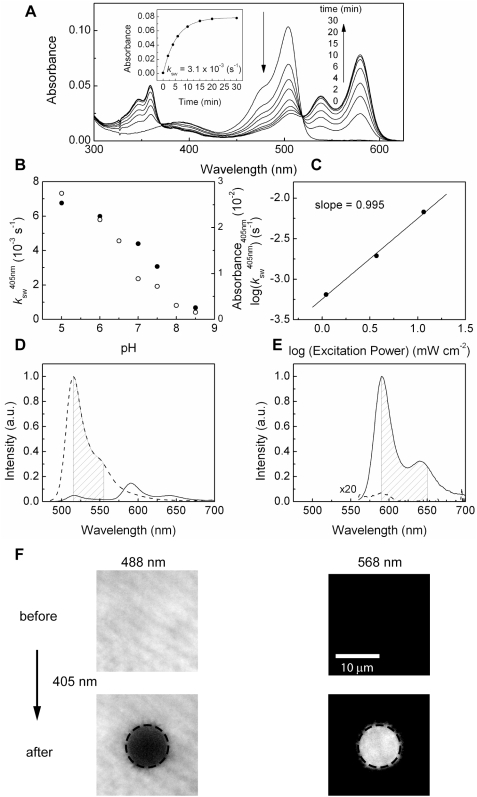
Figure 3. Kinetics of photoswitching from the green to red mKikGR.
(A) Time course of the absorption spectra of mKikGR (4.7 µM, pH 7.5) on illumination at 405 nm (12 mW cm−2). (Inset) Time course of the peak absorbance of the red mKikGR (580 nm). The solid line shows the fitting with a first-order kinetic model. (B) pH dependence of the rate of the photoswitching (solid circles, left axis) and absorbance at 405 nm (open circles, right axis). (C) Excitation power dependence of the photoswitching. The rates were determined at pH 5.0. (D, E) Fluorescence spectra of mKikGR before (dashed lines) and after (solid lines) photoswitching. The spectra were measured with 475 nm (D) excitation and 555 nm (E) excitation. (F) The top panels show fluorescence images of the green (left) and red (right) mKikGR embedded in the thin film of polyacrylamide gel (10 µM, pH 7.0). The wavelength regions that emission filters transmit are indicated by shadow in Fig. 2D (green) and 2E (red). The region indicated by circle was illuminated with 405 nm light (1 sec, 6.3 W cm−2). The bottom panels show fluorescence images of the green (left) and red (right) mKikGR.

