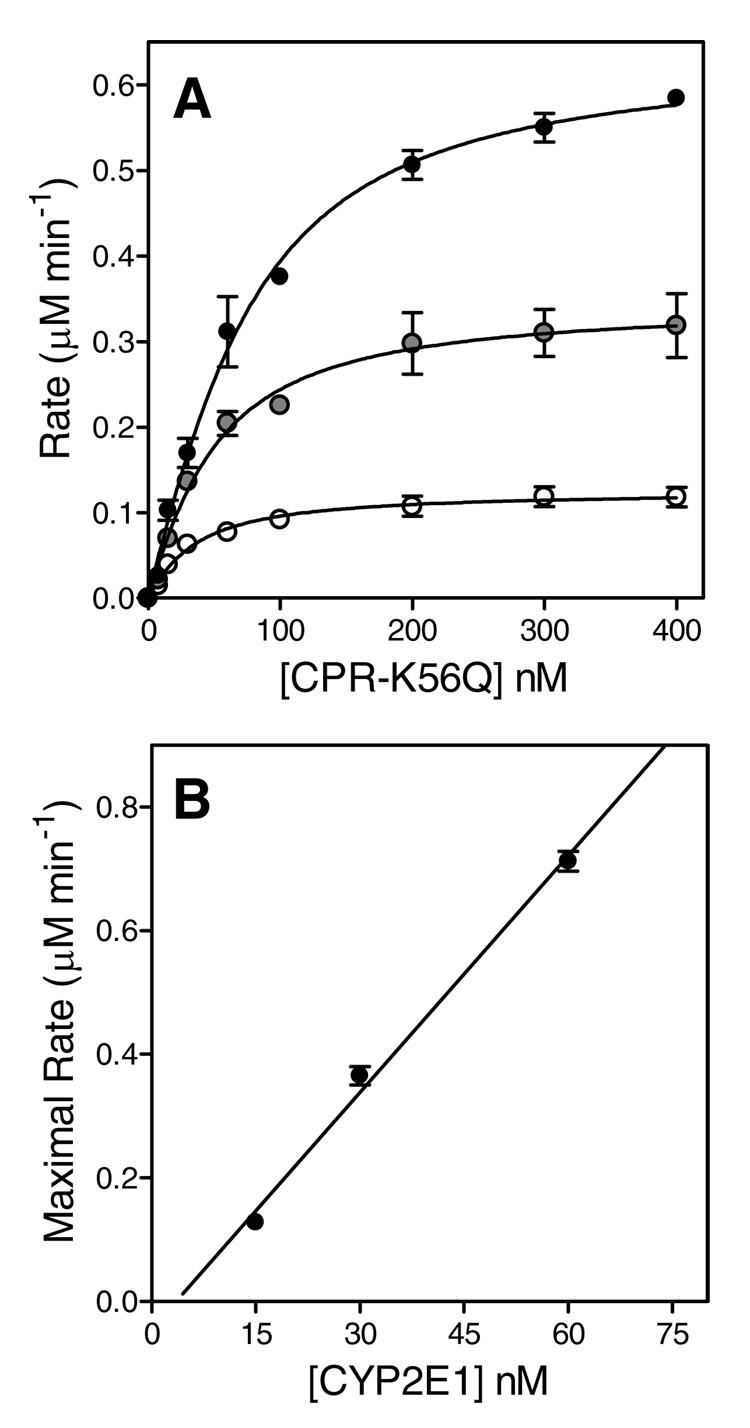
FIGURE 1.
Catalytic titrations using CPR-K56Q as the titrant. (A) Reaction rates were plotted as a function of CPR-K56Q concentration. The reported values reflect the results from average of 2–4 experiments including the standard deviation of the mean. The concentration of P450 2E1 in each titration was 15, 30, and 60 nM, as indicated by the white to black filling of the respective circles. The fitted line reflects the fit of each data set to a binding quadratic equation (Equation 1). (B) The maximal rates from each titration were plotted as a function of the concentration of the limiting complex partner, P450 2E1, and then fit to a linear regression to determine kcat.

