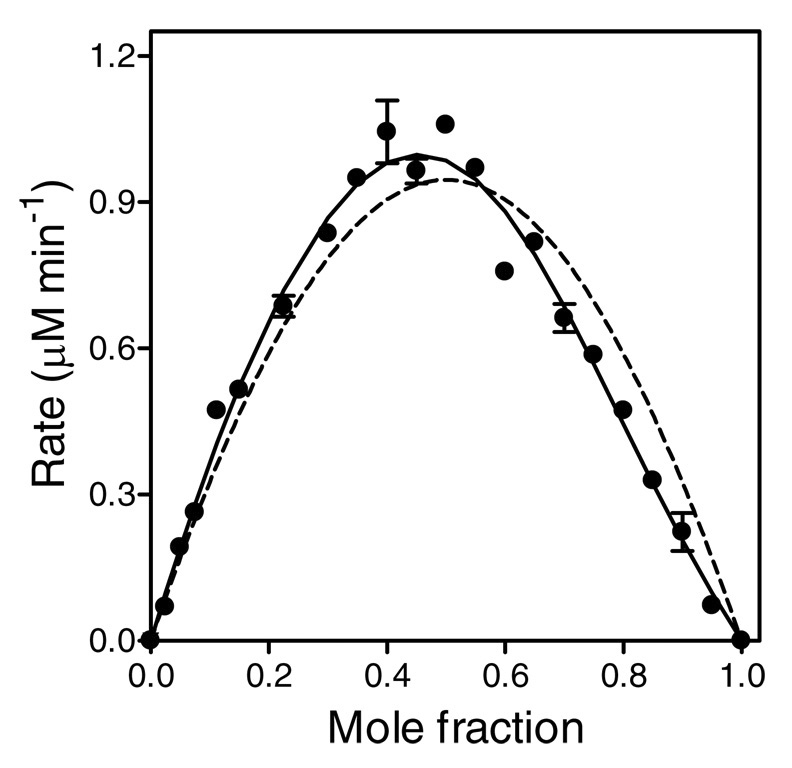
FIGURE 3.
Job plot at a total protein concentration of 400 nM. The mole fraction (x) is defined by [P450 2E1]/([P450 2E1] + [CPR-K56Q]). Reaction rates were measured while CPR-K56Q and P450 2E1 concentrations were varied such that the total protein concentration remained 400 nM. These data were fit to two different models using DynaFit (23) The dashed curve represents the best least-squares fit to the binary complex model (Scheme 1). The solid represents the fit to a model possessing a binary (P450•CPR) and ternary (P450•CPR2) complex.

