
Figure 3.
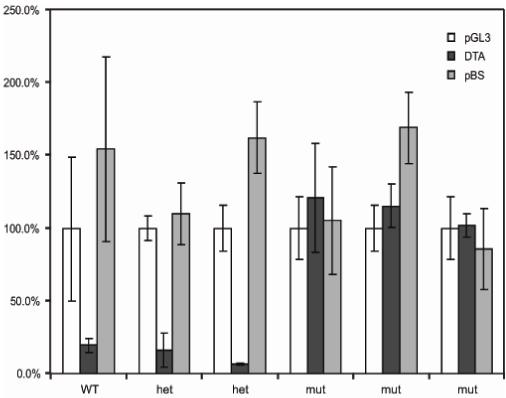
The activity of diphtheria toxin on mouse embryonic fibroblasts. White bars indicate luciferase activity following transfection of pGL3-P luciferase reporter alone into the cells. Black bars show luciferase activity after transfection of the luciferase reporter plus pPGK-DTA at a molar ratio of 4:1. Grey bars are cotransfection control showing luciferase activity following transfection of the luciferase reporter plus pBluescript vector only, at a molar ratio of 4:1. Transfections into six different cell lines are shown representing one wild-type (WT), two heterozygous (het) and three homozygous mutant (mut) genotypes. For each set of transfections the mean of the luciferase reporter alone is normalized to 100%. Error bars are +/- standard deviation.