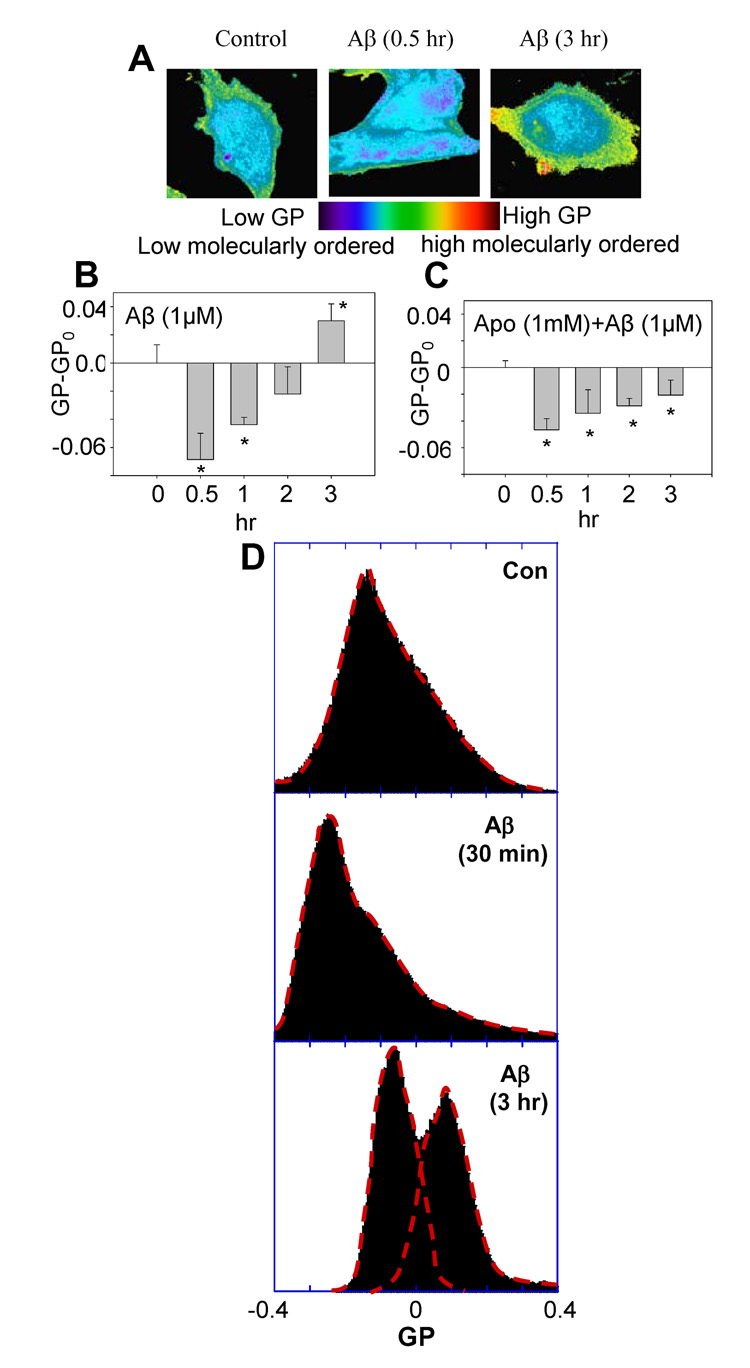
Fig. 1.
Aβ42 induced temporal biphasic changes of membrane molecular order in DITNC cells. (A) Pseudo-colored GP-map images of DITNC cells were reconstructed based on the GP value of each pixel. Control (left); a GP-mapped image taken at 0.5 hr after treatment with 1 µM of Aβ42 (middle); a GP-mapped image acquired at 3 hr after treatment with 1 µM of Aβ42 (right). (B) The GP-GPo (GPo= −0.0030±0.016, is the GP of control sample without Aβ42 treatment at time = 0) exhibited a negative value at 0.5 hr after Aβ42 treatment to cells, indicating more molecularly-disordered membranes, but a positive value at 3 hr, indicating more molecularly-ordered membranes. (C) The GP-GPo (GPo=0.074±0.0051, is the GP of control sample treated with Apocynin (1mM) in DMSO) exhibited only negative values in cells pretreated with apocynin (1 mM) for 1 h followed by Aβ42 (1 µM) treatment. (D) Changes of GP distribution in response to the treatment of cells with Aβ42; without treatment (upper); treatment with Aβ42 for 30 min (middle); treatment with Aβ42 for 3 hr (lower).

