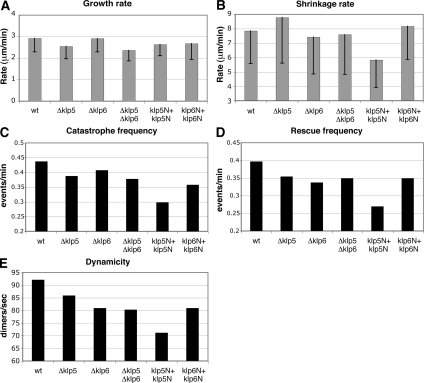
Figure 6.
Microtubule dynamics in various Klp5/Klp6 mutants. Various parameters representing microtubule dynamics (A, growth rate; B, shrinkage rate; C, catastrophe frequency; D, rescue frequency; and E, dynamicity) were quantified in indicated strains: wild type, Δklp5, Δklp6, Δklp5 Δklp6, Klp5N+Klp5N, and Klp6N+Klp6N (see Table 2 for detailed experimental values). Rates of microtubule growth (A) and shrinkage (B) are shown with box-and-whisker plots.

