Figure 5.
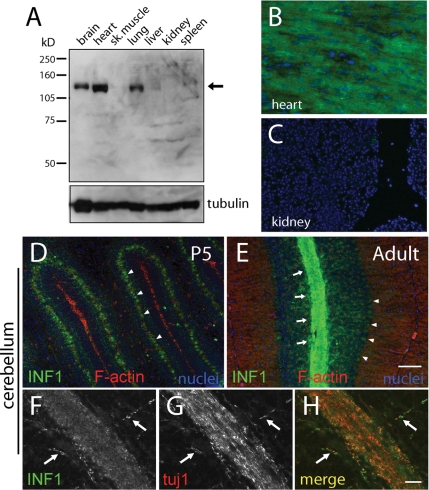
Expression of INF1 in mouse tissues. (A) Immunoblot of mouse tissues showing expression of INF1 protein (arrow) in brain, heart, and lung. (B) By immunofluorescence analysis, INF1 was readily detectable in ventricular muscle of the heart. (C) At an identical exposure as in B, an immunofluorescence signal was barely detectable in kidney, corresponding to immunoblotting results shown in A. (D) INF1 (green) staining in a 5-d-old (P5) mouse cerebellum coronal section. The section was counterstained for F-actin (red) and chromatin (blue). INF1 staining in Purkinje neuron cell bodies is indicated by the arrowheads. (E) Sagittal brain section showing INF1 (green) staining with F-actin (red) labeling in the cerebellum of a 2-mo-old (adult) mouse. Arrows point to the white matter layer, and arrowheads to the Purkinje neuron cell bodies. (F–H) Higher magnification confocal images showing INF1 (F) with tuj1 (βIII-tubulin; G) in axons. The merged image is shown in E. Although INF1 was consistently associated with tuj1 staining, they did not necessarily colocalize. Scale bar, (D and E) 20 μm, (F–H) 10 μm.

