
Figure 1.
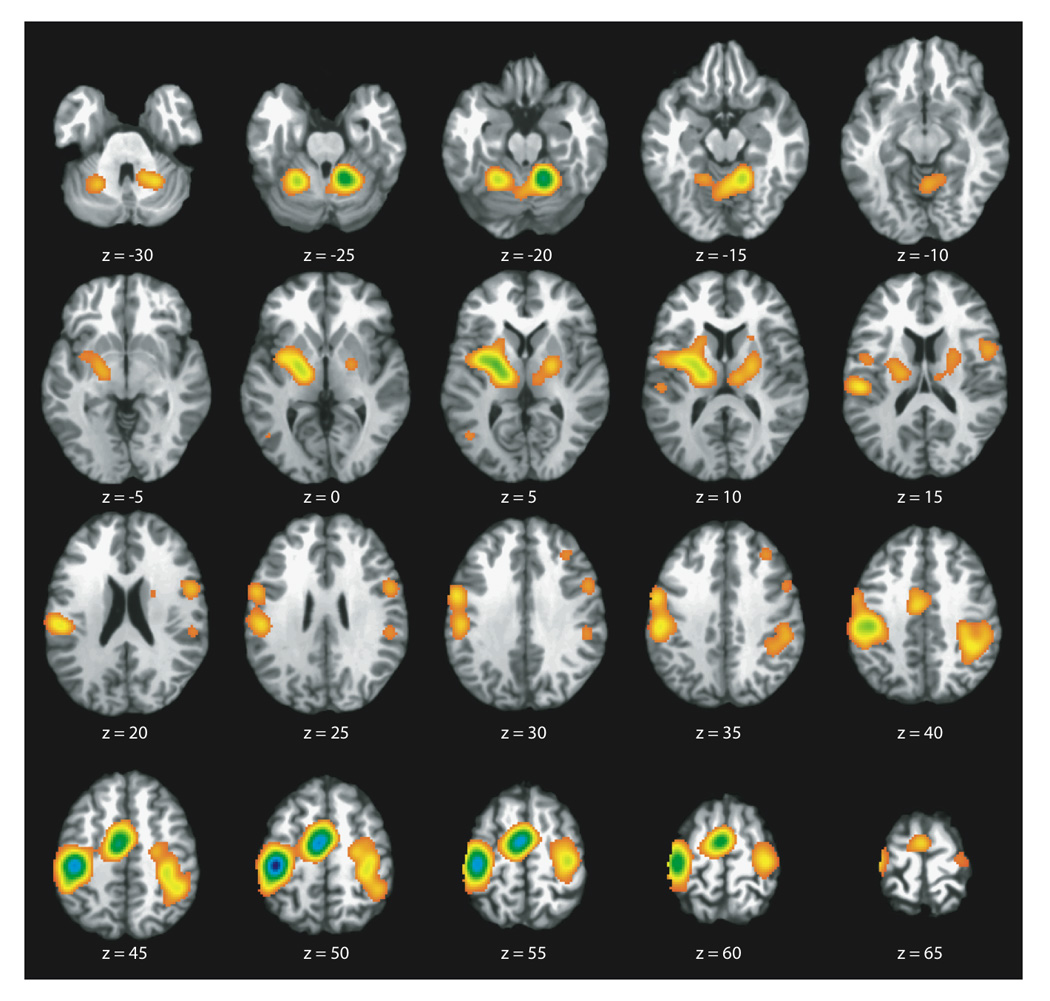
ALE Map of the Main Effects (All Finger Tapping Task Variations). Axial slices representing full brain coverage are shown (P < 0.05; FDR corrected). Robust concordance is seen in bilateral sensorimotor cortices, supplementary motor area, left ventral premotor, bilateral inferior parietal cortices, bilateral basal ganglia, and bilateral anterior cerebellum.