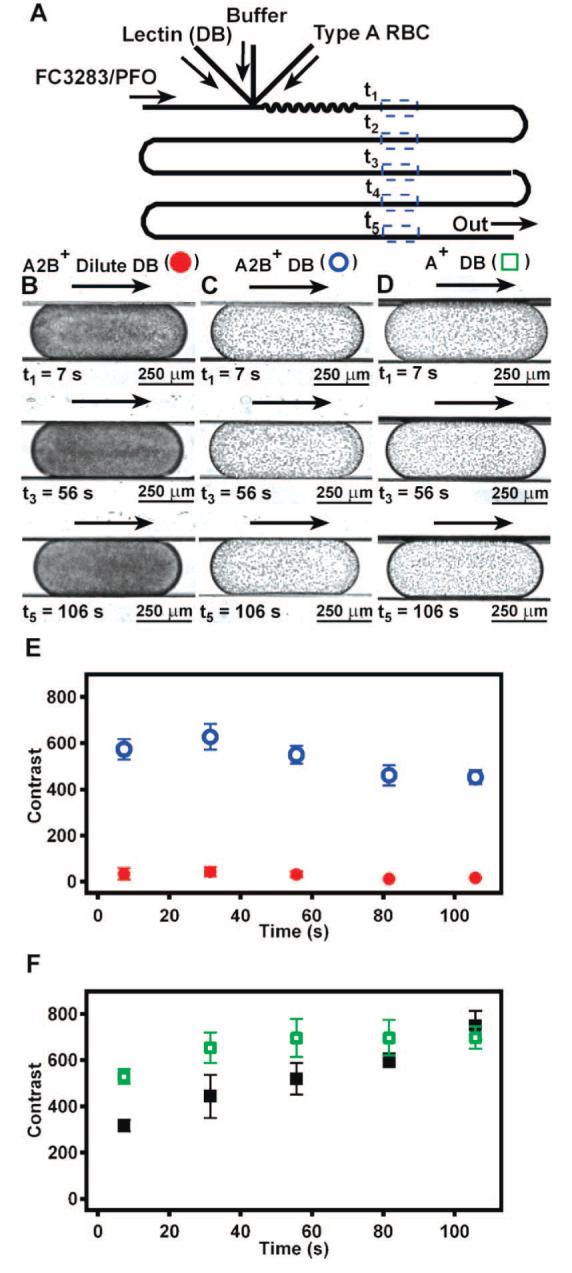
Figure 3.

Microfluidic subtyping of type A RBCs by on-chip dilution of lectin from D. biflorus (DB). (A) A schematic drawing shows the microfluidic device used for subtyping. Flow rate of lectin DB and buffer were varied to achieve low and high lectin DB concentrations, while the flow rate of RBCs and the carrier fluid remained constant. (B) Low lectin DB concentration (0.09 mg/mL) did not agglutinate subtype A2B+ RBCs, because plugs were dark and uniform in color, indicating no agglutination. (C) High lectin DB concentration (0.72 mg/mL) resulted in agglutination of subtype A2B+ RBCs, as expected for RBCs of subtype A2. Images in panels B and C correspond to red (solid circles) and blue (hollow circles) data points in panel E, respectively. (D) Type A+ RBCs agglutinate at both low and high lectin DB concentrations (images at low concentration of lectin DB not shown), indicating that these RBCs were subtype A1. Images in panel D correspond to green (hollow) data points in panel F. (E) Contrast variation in plugs containing subtype A2B+ RBCs at low (red solid circles) and high (blue hollow circles) lectin DB concentration quantitatively show the presence of agglutinins over time. (F) Contrast variation in plugs containing type A+ RBCs of unknown subtype at low (black solid squares) and high (green hollow squares) lectin DB concentration quantitatively show the presence of agglutinins over time. In panels E and F, n = 3 plugs. Arrows indicate the direction of flow.
