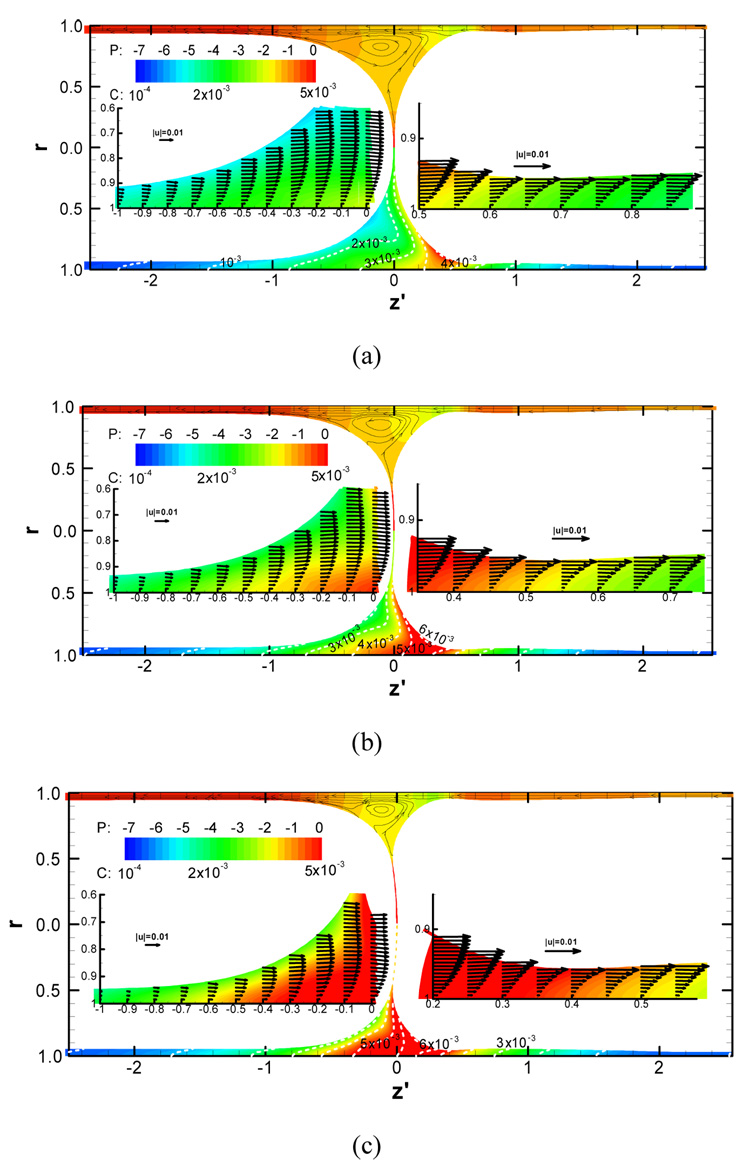
Figure 7.
Flow, pressure (upper half) and bulk surfactant concentration (lower half) fields for the precursor film thickness of h2=0.03, the initial LP=1, ΔP=1 and C0=5×10⁻⁴ at (a) t=900, (b) t=1200 and (c) t=1500. Upper half of each panel displays the pressure contours and streamlines. Lower half of each panel shows the surfactant concentration contours. The magnified plots within both transition regions are shown with the velocity vectors. From Fujioka et al. (2008).

