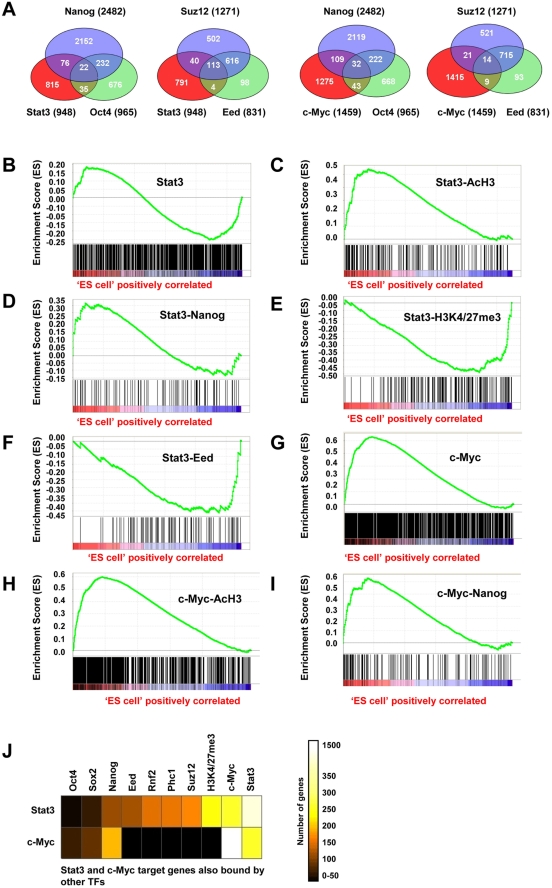
Figure 6. Association between TF co-occupancy and expression profile in ES cells and EBs.
(A) Relationship between Stat3 and c-Myc bound genes with Nanog, Oct4, Eed, and Suz12 bound genes. GSEA analysis of (B) Stat3 target genes, (C) Stat3 target genes with AcH3 marks, (D) Stat3/Nanog target genes, (E) Stat3 target genes with H3K4/27me3 marks, and (F) Stat3/Eed target genes in ES cells and differentiated EBs. GSEA analysis of (G) c-Myc target genes, (H) c-Myc target genes with AcH3 marks, and (I) c-Myc/Nanog target genes in ES cells and differentiated EBs. Red indicates active genes in ES cells and blue indicates active genes in EBs. (J) Relationship between Stat3 and c-Myc target genes, Oct4/Sox2/Nanog target genes, polycomb repressive complex 1 (Rnf2/Phc1), polycomb repressive complex 2 (Suz12/Eed), and genes with histone marks H3K4/27me3. The number of genes co-bound by Stat3 or c-Myc is displayed.

