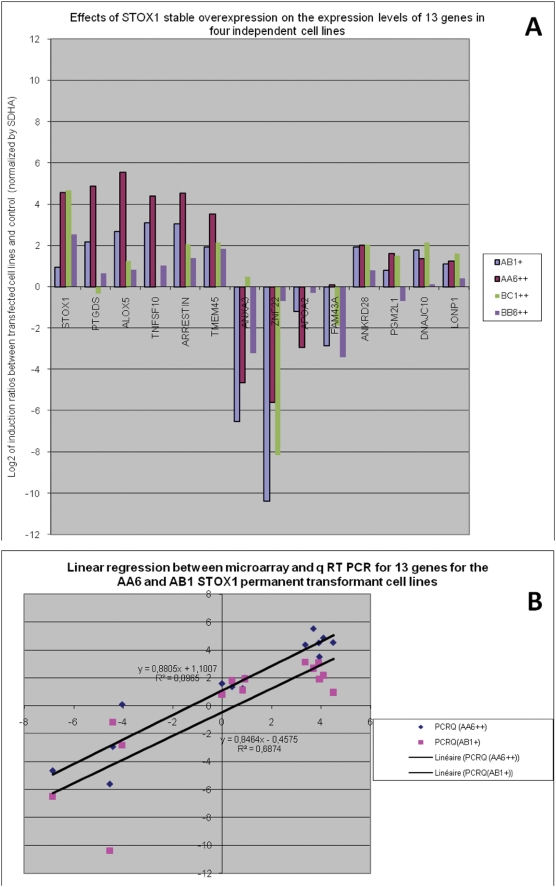
Figure 2.
(A) Comparison of four cell lines overexpressing STOX1 for a series of 13 genes known to be modified by the microarray experiment, by quantitative RT-PCR. Five genes were overexpressed (PTGDS, ALOX5, TNFSF10, βARRESTIN, TMEM45a), four down-regulated (ANXA3, ZNF22, APOA2, FAM43A) and four mildly induced or unmodified (ANKRD28, PGM2L1, DNAJC10, LONP1). The diagram shows a fairly good reproducibility of the gene alterations whatever the cell line overexpressing STOX1. The expression level of STOX1 is represented in the first series of histograms. (B) Comparison of the expression levels of the microarray and of the qRT-PCR results for the same series of 13 genes. For AA6, the cell line from which the cDNA hybridized on the microarrays was obtained, the correlation is excellent (R = 0.944). For the second line AB1, overexpressing STOX1 at a milder level, the correlation is also very good (R = 0.829). In this case, the overall expression is nevertheless lower as shown by the linear regression. This suggests that at least in some cases, the deregulations induced by STOX1 overexpression are somehow proportional to this overexpression.

