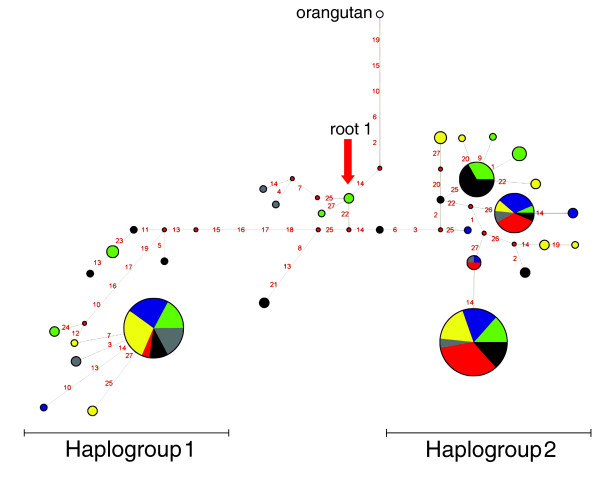
Figure 2.
Genealogy of DEFB1 haplotypes reconstructed through a median-joining network. Each node represents a different haplotype, with the size of the circle proportional to the haplotype frequency. Also, circles are color-coded according to population (green, AA; black, YRI; blue, EA; yellow, AS; red, SAI; gray, AUA). The red arrow indicates root 1 (see text). Nucleotide differences between haplotypes are indicated on the branches of the network. The orangutan sequence is also shown.

