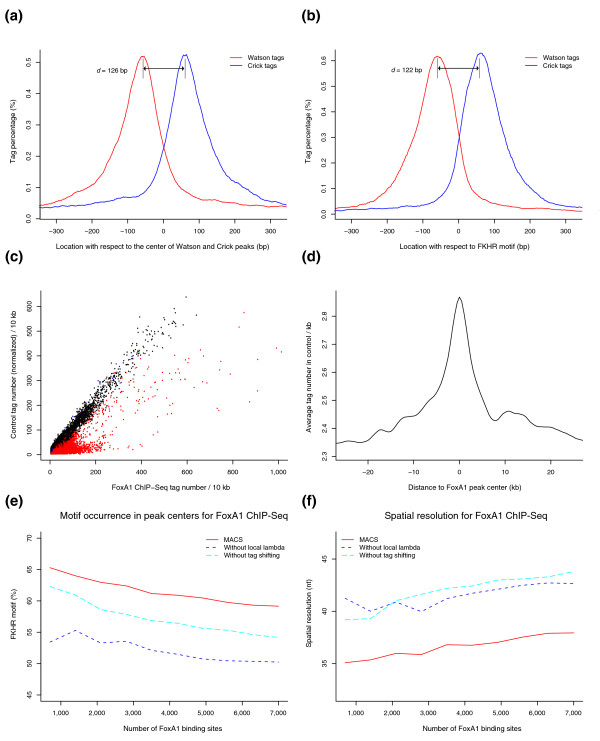
Figure 1.
MACS model for FoxA1 ChIP-Seq. (a,b) The 5' ends of strand-separated tags from a random sample of 1,000 model peaks, aligned by the center of their Watson and Crick peaks (a) and by the FKHR motif (b). (c) The tag count in ChIP versus control in 10 kb windows across the genome. Each dot represents a 10 kb window; red dots are windows containing ChIP peaks and black dots are windows containing control peaks used for FDR calculation. (d) Tag density profile in control samples around FoxA1 ChIP-Seq peaks. (e,f) MACS improves the motif occurrence in the identified peak centers (e) and the spatial resolution (f) for FoxA1 ChIP-Seq through tag shifting and λlocal. Peaks are ranked by p-value. The motif occurrence is calculated as the percentage of peaks with the FKHR motif within 50 bp of the peak summit. The spatial resolution is calculated as the average distance from the summit to the nearest FKHR motif. Peaks with no FKHR motif within 150 bp of the peak summit are removed from the spatial resolution calculation.

