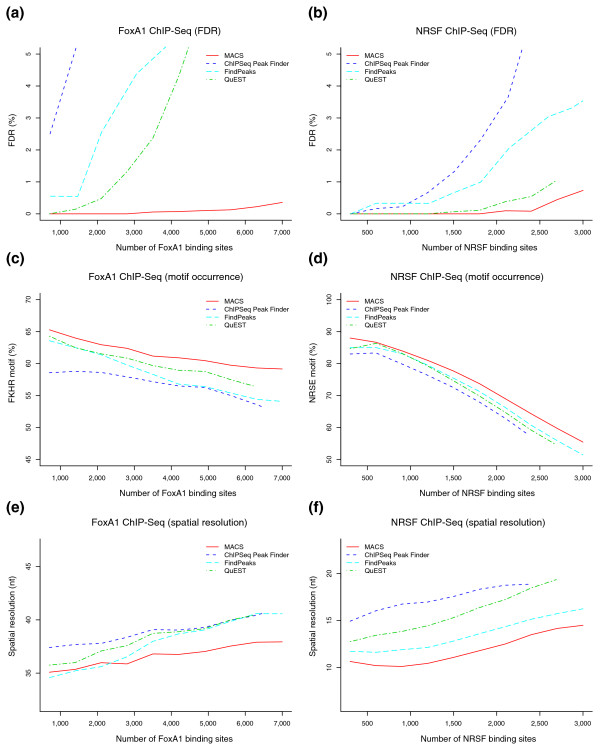
Figure 2.
Comparison of MACS with ChIPSeq Peak Finder, FindPeaks and QuEST. (a-f) Shown is the FDR for FoxA1 (a) and NRSF (b) ChIP-Seq, motif occurrence within 50 bp of the peak centers for FoxA1 (c) and NRSF (d), and the average distance from the peak center to the nearest motif (peaks with no motif within 150 bp from peak center are removed) for FoxA1 (e) and NRSF (f).

