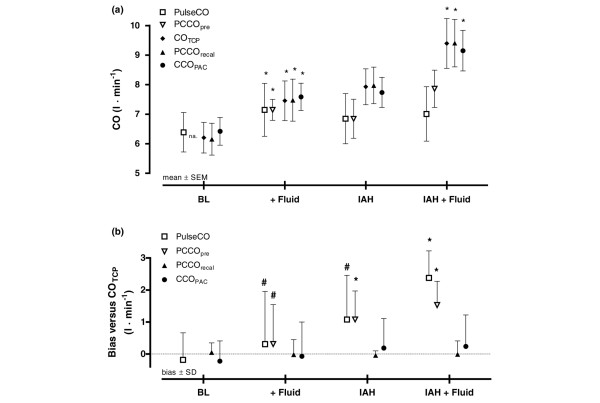
Figure 2.
Distribution and bias of cardiac output methods. (a) Cardiac output (CO) measured by the different CO methods at each experimental step. (b) Bias and precision (standard deviation (SD)) between bolus transcardiopulmonary thermodilution cardiac output (COTCP) and the different CO methods at each experimental step. PulseCO, continuous cardiac output by pulse power analysis (LiDCO system); PCCO, continuous cardiac output by pulse contour analysis (PiCCO system); CCOPAC, continuous cardiac output by pulmonary artery catheter thermodilution. PCCO was measured before recalibration (PCCOpre) and after recalibration (PCCOrecal) by COTCP. *P < 0.05 versus the previous experimental stage (PCCOpre versus previous PCCOrecal). #Methods not interchangeable according to Critchley and Critchley [21]. Filled symbols, calibrated measures. Experimental steps: BL, baseline; + Fluid, fluid loading; IAH, intra-abdominal hypertension; IAH + Fluid, second fluid load at IAH. IAP, intra-abdominal pressure; na, not applicable; SEM, standard error of the mean.

