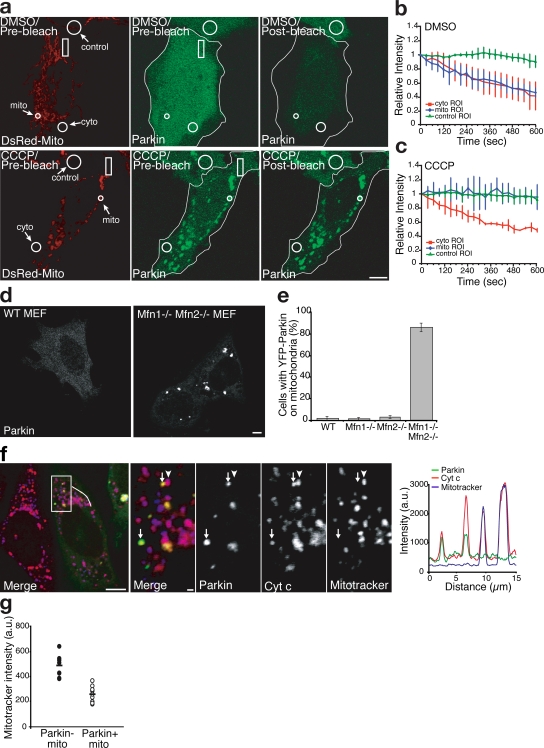
Figure 2.
FLIP analysis of Parkin diffusibility and selectivity of Parkin accumulation. (a–c) FLIP analysis with quantification after treatment with DMSO (a, top, and b) or CCCP (a, bottom, and c; n ≥ 3 in each treatment). Rectangles in panel a indicate the bleach ROI. Outlines demarcate the edges of cells expressing YFP-Parkin. (d) YFP localization in WT and Mfn1−/−,Mfn2−/− double knockout MEF cells expressing YFP-Parkin. (e) YFP-Parkin scored for colocalization as in Fig. 1 f. Error bars indicate standard deviation of at least three replicates. (f) Mfn1−/−,Mfn2−/− double knockout MEF cells transfected with YFP-Parkin (green) and pulsed with the potentiometric dye MitoTracker (blue in merge) 15 min before fixation. Cells were immunostained for cytochrome c (red). A line scan of fluorescence through two Parkin-positive mitochondria depicts colocalization between Parkin, MitoTracker, and cytochrome c. The right four panels show an enlarged view of the boxed area. Arrows indicate mitochondria (identified by anti–cytochrome c) that were depolarized (as assessed by their failure to take up the dye MitoTracker; arrowheads represent mitochondria (identified by anti–cytochrome c) that were electrochemically active (as assessed by their ability to take up the dye MitoTracker). YFP-Parkin colocalizes with depolarized mitochondria (arrows) but not with electrochemically active mitochondria. (g) The mitochondrial volume for each Mfn1−/−,Mfn2−/− MEF cell was segregated into Parkin-positive and Parkin-negative subsets. Mean MitoTracker fluorescence intensity was measured for each subset (n = 9). Bars: (a, d, and f, left) 5 μm; (f, right four panels) 1 μm.

