Figure 3.
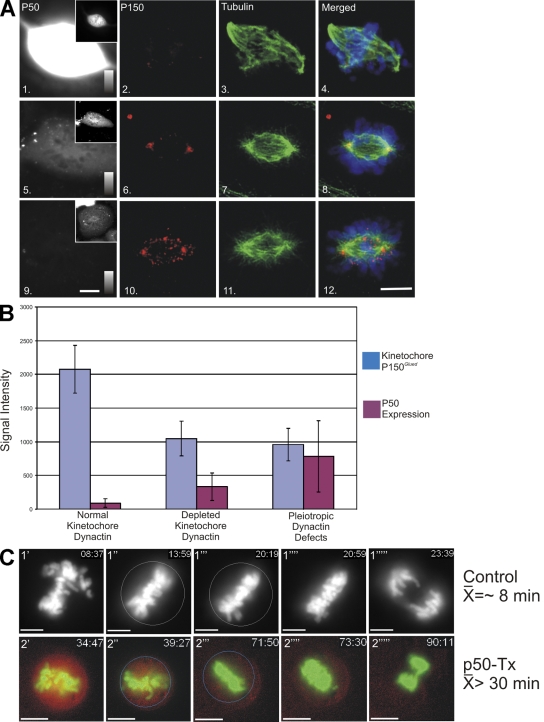
Impact of p50(dynamitin) expression on kinetochore dynactin and spindle integrity. (A) NRK2 cells expressing high (panels 1–4), moderate (panels 5–8), and low (panels 9–12) levels of mCherry-tagged p50(dynamitin) (panels 1, 5, and 9) were stained for p150Glued (panels 2, 6, and 10) and tubulin (panels 3, 7, and 11). Images of p50(dynamitin) levels are scaled the same in panels 1, 5, and 9 and can be compared using the intensity scales in each panel. The insets in panels 1, 5, and 9 demonstrate transfection of each example and the distribution of the transfected protein. These cells (n = 89) were used to correlate expression levels with mitotic defects. (B) Transfectants were binned into three categories based on level of expression: (1) low levels of expression (mean = 99, n = 31), which displayed no defects in kinetochore dynactin or spindle formation; (2) moderate levels of expression (mean = 381, n = 27), which displayed loss of kinetochore dynactin but normal spindle function; and (3) high levels of expression (mean = 980, n = 31), which displayed pleiotropic defects in spindle function and loss of kinetochore dynactin. Error bars represent SD. (C) NRK2 cells expressing GFP-H2B were subjected to time-lapse imaging. In controls (1′–1′′′′′), time-lapse sequences were used to determine the point of chromosome alignment, and the chromosome mass was circled (1′′). The timing of anaphase onset is indicated by deletion of the circle (1′′′′), and the time between these points was recorded. The mean time for controls (8.055 ± 3.01 min; n = 10) differed from cells transfected with mCherry-tagged p50(dynamitin) (p50-Tx; 2′–2′′′′′) cells that initiated anaphase a mean of 17.60 ± 7.9 min after alignment (n = 10). Another population of p50-transfected cells never entered anaphase within the time frame of imaging (n = 7), and the mean (51.31 ± 24.66 min) reflects the timing until imaging was terminated (Fig. S4 and Videos 1–4, available at http://www.jcb.org/cgi/content/full/jcb.200804114/DC1). Bars, 5 μm.

