
Figure 4.
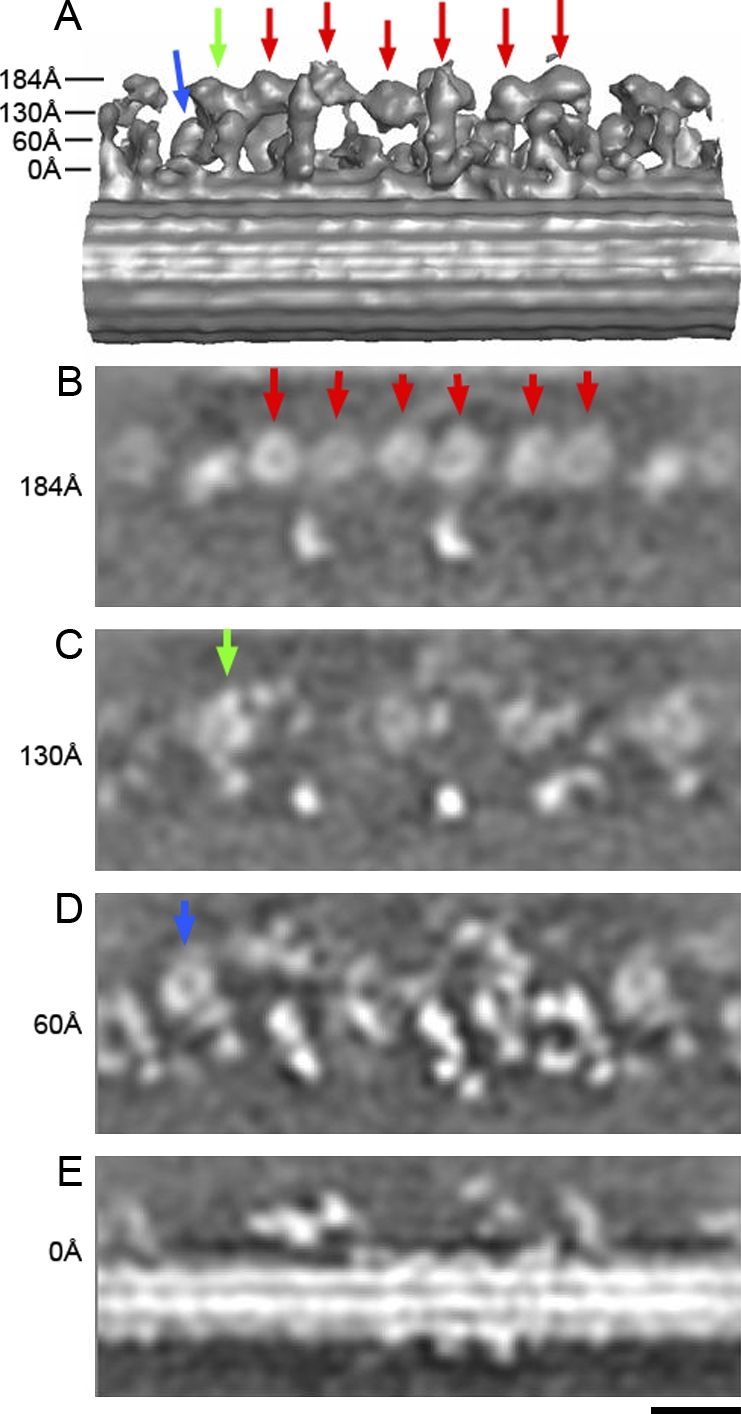
Horizontal sections from the three-dimensional density map of the oda1 mutant at various heights. Arrows in A indicate the heights in the surface rendering model. The six AAA rings (to be assigned as dynein a, b, c, d, e, and g later), and dynein fα and fβ are shown by red, green, and blue arrows, respectively. In horizontal sections (B, C, and D), six of the eight DHC rings are at the same height, whereas two are located closer to the A-microtubule. Bar, 20 nm.