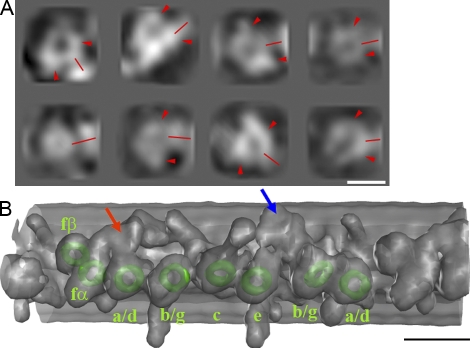
Figure 5.
Detection of the AAA rings in the density map of the oda1 mutant. (A) The eight rings detected in the 96-nm repeat of the oda1 mutant as projections. (left) Proximal end. (right) Distal end. N-terminal tails, which project out between two bulky densities (arrowheads), are shown by red lines. (B) Orientations of the eight rings are shown. Isoforms of dynein heavy chains are indicated by green rings based on Fig. 2. LC–IC complex and DRC are shown by red and blue arrows, respectively. A stereo view of B is shown in Fig. S1 (available at http://www.jcb.org/cgi/content/full/jcb.200808050/DC1). Bars: (A) 10 nm; (B) 20 nm.

