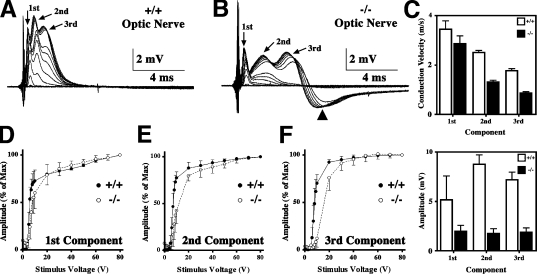
Figure 1.
CAPs in optic nerve from Claudin 11–null mice. (A and B) Representative CAP series from optic nerves of wild-type (+/+) and Claudin 11–null (−/−) mice showing three components (arrows) elicited by square voltage pulses with varied amplitudes. (B) Arrowhead, hyperpolarizing afterpotential from −/− nerves. (C) CVs (top) and amplitudes (bottom) were measured at peak maxima (mean ± SD) from n = 8 (+/+) and n = 7 (−/−) optic nerves. (D–F) Axon recruitment profiles for each component. Greater voltages are required to recruit the majority of fibers from Claudin 11–null mice (open symbols) compared with controls (closed symbols). Error bars indicate SD.

