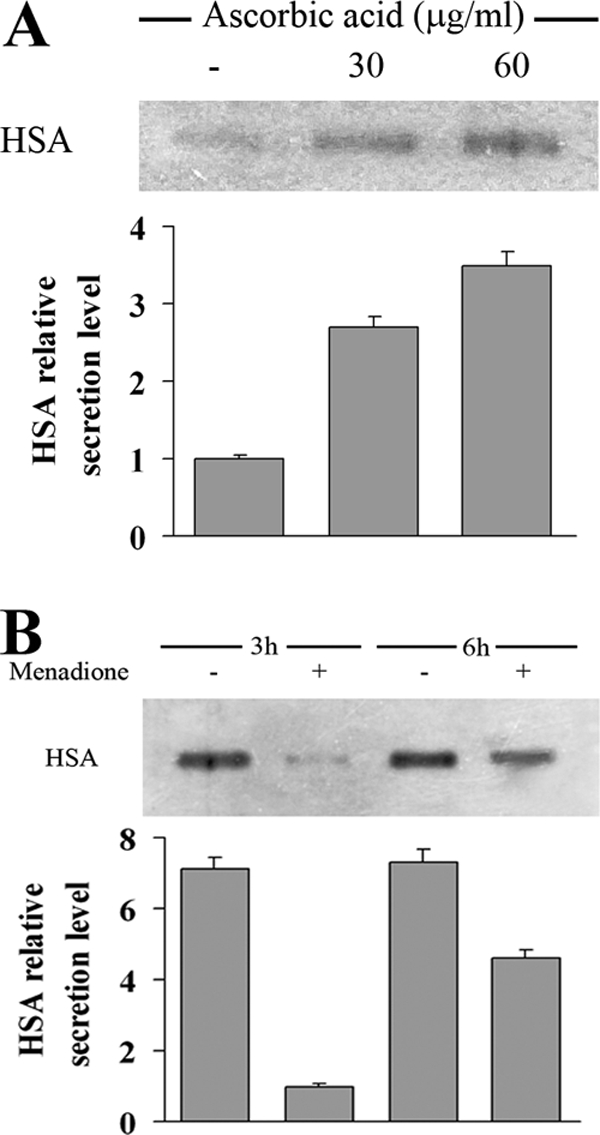
FIG. 6.

(A) HSA production of K. lactis harboring pYG132 vector treated or not (−) for 48 h with 30 and 60 μg/ml of ascorbic acid. Gel lanes were loaded with 5 μl of a 1:10 dilution of cell-free medium. Quantification of the chemiluminescent signal on the blot is shown at the bottom of the panel. The signal from the untreated cells was set at 1. (B) HSA secretion level of the same strain was monitored 3 and 6 h after the challenge with 5 mM menadione for 1 h. A total of 15 μl of cell-free medium was loaded in the gel. Quantification of the chemiluminescent signal on the blot is shown at the bottom of the panel. The signal from the challenged cells 3 h after treatment was set at 1.
