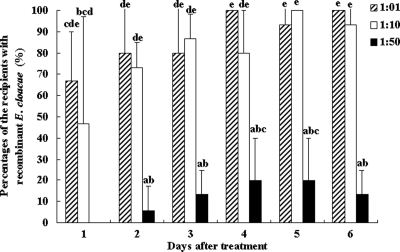
FIG. 5.
Transfer of recombinant E. cloacae among workers with different donor/recipient ratios (1:1, 1:10, and 1:50): percentages of recipients containing recombinant E. cloacae. The data are the averages for three replicates. The error bars indicate standard deviations. Mauchly's test of sphericity showed that there were no significant differences in the repeated-measures data (P > 0.05), so a normal one-way analysis of variance was used. Bars labeled with different letters are significantly different (P < 0.05).

