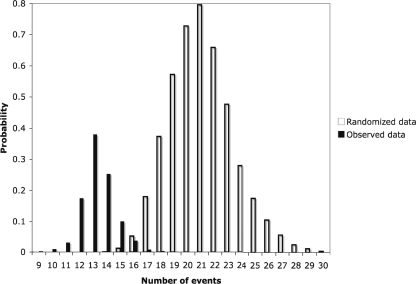
FIG. 4.
Histogram comparing the number of changes needed within the trees constructed by Bayesian analysis to explain the distribution of the mnxG gene in the observed data versus the randomized data. Note that the distribution of observed values falls to the left of the distribution of random values; this indicates that the null hypothesis can be rejected.

