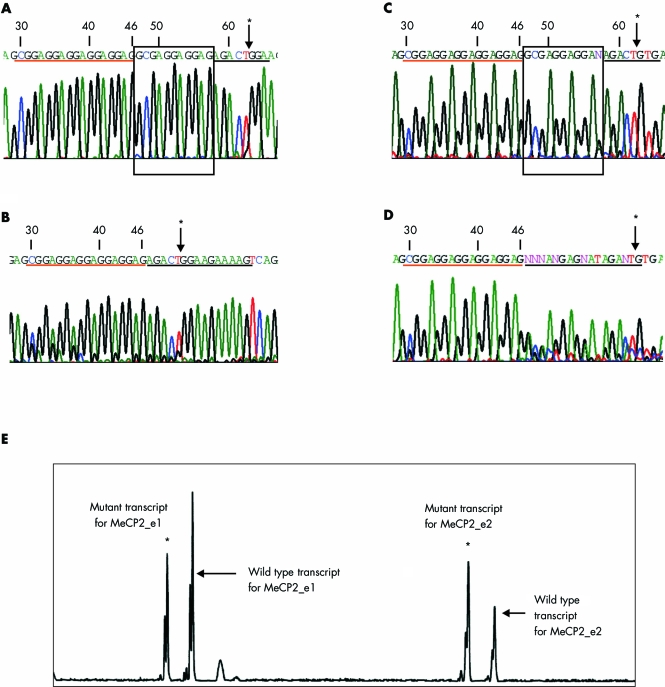
Figure 1 Sequence chromatograms and fragment length analysis. Numbers in the chromatograms correspond to c.DNA sequence for MeCP2_e1 with the A of ATG start site numbered as 1. Arrows marked with an asterisk indicate the exon/exon junction in RNA sequences shown in panels A and B and exon/intron junction in DNA sequences shown in panels C and D. Nucleotides underlined in red are upstream of the deletion, while those in black are downstream. The 11 nucleotide deletion is shown in the box in sequences from normal individuals. (A, B) Sequence chromatograms from the RNA of a normal individual (A) and patient 212 (B). The nucleotides in the box in panel A were found to be deleted in the chromatogram obtained from the RNA of patient 212 shown in panel B. (C, D) Sequence chromatograms from the DNA of a normal individual (C) and patient 212 (D). The deletion is seen as a mixed chromatogram beneath the underlined sequence in the patient DNA in panel D. (E) Fragment length analysis of the mRNA transcripts with GeneScan software. All four RNA transcripts, two arising from the normal allele (indicated by arrows) and two from the mutant allele (indicated by asterisks), are clearly visible. The mutant RNA transcripts differ from the wild type RNA transcripts by 11 nucleotides.

An official website of the United States government
Here's how you know
Official websites use .gov
A
.gov website belongs to an official
government organization in the United States.
Secure .gov websites use HTTPS
A lock (
) or https:// means you've safely
connected to the .gov website. Share sensitive
information only on official, secure websites.
