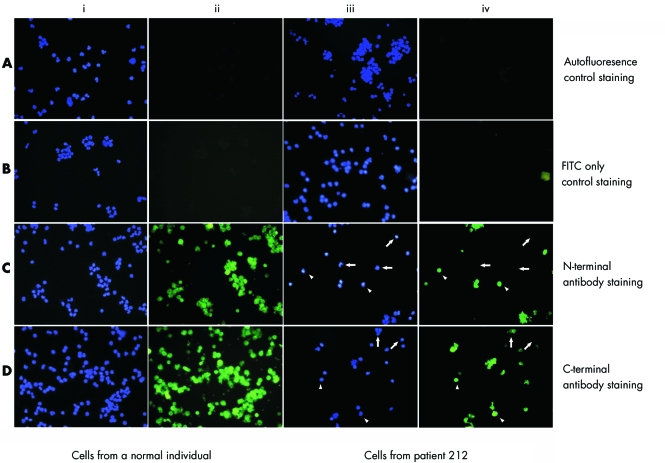
Figure 2 Immunofluorescence analysis of peripheral blood lymphocytes. Panels i and ii show cells from a normal individual immunostained with DAPI (blue) and FITC (green), respectively. Panels iii and iv show cells from patient 212 stained with DAPI in blue and FITC in green, respectively. Panel A shows autofluorescent controls where no primary or secondary antibody was used during staining. Panel B shows FITC only staining controls, where cells were stained with the secondary antibody (mouse anti‐rabbit FITC) alone. Note green staining of cells is not detectable in the negative controls from a normal subject (i and ii) and patient 212 (iii and iv) shown in panels A and B. Cells stained with the antibody against the N‐terminal epitope are shown in panel C and cells stained with the antibody against the C‐terminal epitope are shown in panel D. All cells from a normal individual show positive green staining with antibodies against the N‐terminal and C‐terminal shown in panels i and ii. Note the mixture of green staining positives (indicated by arrowheads) and non‐staining negatives (indicated by arrows) in cells from the patient shown in panels iii and iv. In patient cells, 76% of cells stained positive with the antibody against the N‐terminal of MeCP2 and 74% stained positive with the antibody against the C‐terminal of MeCP2.

An official website of the United States government
Here's how you know
Official websites use .gov
A
.gov website belongs to an official
government organization in the United States.
Secure .gov websites use HTTPS
A lock (
) or https:// means you've safely
connected to the .gov website. Share sensitive
information only on official, secure websites.
