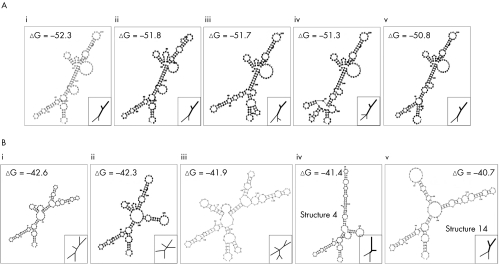
Figure 3 Predicted secondary structure analysis of wild type and mutant 5′‐UTR of MeCP2_e2 using Mfold. (A) The five most stable secondary structure predictions of the wild type MeCP2_e2 5′‐UTRs are shown in panels i–v. (B) Panels i–iv show the four most stable secondary structures predicted for the mutant MeCP2_e2 5′‐UTR, including structure 4. Panel v shows predicted structure 14. Simplified tree graphs drawn for each structure are depicted as insets. The Y shaped structure is indicated in bold within the insets. Only structures 4 and 14 of the mutant sequence show similarity to the tree graphs of the wild type structures with subtle differences that are discussed in the text.

An official website of the United States government
Here's how you know
Official websites use .gov
A
.gov website belongs to an official
government organization in the United States.
Secure .gov websites use HTTPS
A lock (
) or https:// means you've safely
connected to the .gov website. Share sensitive
information only on official, secure websites.
