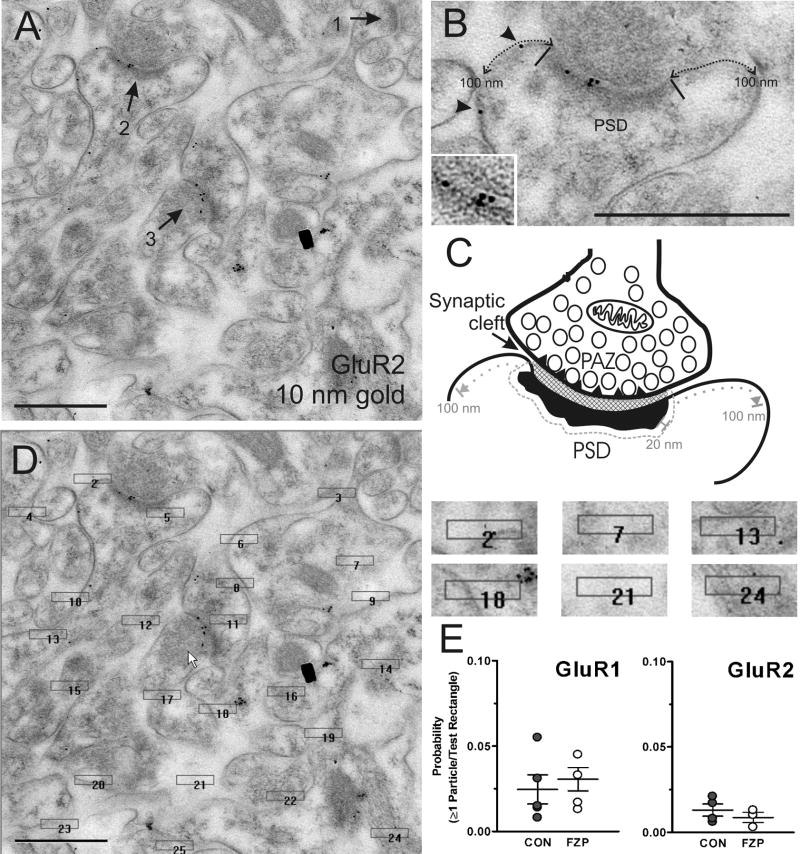
Figure 1.
Location of immunogold labeling. (A) Full-field image of a digital electron micrograph of the CA1 SR region used in the analysis and containing three synapses (arrows 1, 2 and 3). Two of them contain GluR2-immunogold labeling (10 nm particles). All the synapses analyzed are clearly asymmetric and many can be identified on spine heads. (B) Magnified view of synapse 2 showing the lateral edges of the PSD region (black bars), extrasynaptic GluR2-immunolabeling (arrowheads) and the approximate 100 nm plasma membrane regions that were considered as “perisynaptic” on these cross-section analyses (dotted line). The inset shows labeling at high contrast to better define pre-and postsynaptic membranes. (C) Depicts a diagram of a synapse similar to the one shown in B marking the presynaptic active zone (PAZ) (triangles inserted in the membrane of the presynaptic bouton), opposed by a synaptic cleft (generally more electron-dense than the extrasynaptic intercellular space) and the PSD region. Immunogold particles related to the PSD were counted if they were located within a 20 nm boundary region surrounding the edges of the PSD. This region included all the synaptic cleft area. Particles were considered extrasynaptic if clearly located on the membrane and within a 100 nm distance of the PSD (excluding the 20 nm drop zone associated with the PSD). (D) Test rectangles on top of the image shown in A. The immunogold content in these rectangles was used to calculate the probability that one or more particles were randomly associated with a region similar to the PSD. Test rectangles were 0.22 × 0.045 μm in size and randomly placed on the images. (E) The probabilities that one or more gold particle was related to a test rectangle was less than 5% in both GluR1 and GluR2 labeled synapses in both control and FZP-withdrawn rats. Scale bars in A, B and D are 0.5 μm.

